A simple tiled web map showing storm surge data.
Riha, S.1 Abstract
We describe a simple web application for viewing data related to storm surges on a tiled web map. Corrections and comments via E-mail are appreciated.
2 Introduction
These are notes on a simple web application for viewing data related to storm surges on a tiled web map. The application was hosted on Amazon Web Services (AWS) infrastructure during about 5 years. At the time of writing, we are reorganizing our computing infrastructure, and the web app will become unavailable in its current form. In this blog post we document its former functionality and appearance.
Our core interest is the processing of oceanographically relevant data, mostly focused on storm surge risk assessment. Application programming for end users is not a core activity, but constructing and maintaining a simple "demo" application can have several benefits:
- Non-expert users can familiarize themselves with the type of data that we typically work with.
- Learning the basics of "web programming", both for the frontend (Javascript/Typescript, HTML, CSS), and for the backend, can be advantageous for people working with geophysical data.
- Learning the basics of system administration is also valuable. The provisioning, maintenance and monitoring of IT infrastructure is a fundamental prerequisite for reliably providing "near real-time" data services for oceangoraphic or meteorological applications, especially in operational settings.
- Learning about geospatial/GIS applications (GDAL/OGR, QGIS, etc.) was unfortunately not part of the author's university curriculum, even though their use is arguably indispensable when working with geophysical data. Constructing a simple tiling map application can be a great hands-on learning experience in this regard.
3 Data sources and providers
3.1 National Storm Surge Risk Maps
The U.S. National Hurricane Center (NHC) publishes seamless composite inundation maps (Zachry et al., 2015) using data from the SLOSH model (NHC, 2023c). The maps contain contours of the maximum flooding caused by Category 1-5 hurricanes, computed by simulating a large number of hurricanes and composing the results. The dataset is described in NHC (2023b), and it can be downloaded as GeoTIFF files. An interactive map viewer (NHC, 2023a) hosted by ArcGIS/Esri (Esri, 2023) is available for easy access to the data.
3.2 National Flood Hazard Layer
The U.S. Federal Emergency Management Agency (FEMA) publishes the National Flood Hazard Layer (NFHL), which is a geospatial database that allows citizens to better understand their exposure to flood risk (FEMA, 2023b). FEMA provides a variety of public services to access NFHL data, and for our purposes we choose FEMA's OGC Web Mapping Service (WMS) portal (FEMA, 2023a).
3.3 National Elevation Dataset, 3D Elevation Program
At the time of implementation, the U.S. Geological Survey distributed a seamless raster elevation data product for the United States, called the National Elevation Dataset (USGS, 2023b). This single data set is derived from diverse source data sets that are processed to a specification with a consistent resolution, coordinate system, elevation units, and horizontal and vertical datums. The term National Elevation Dataset (NED) has meanwhile been retired (USGS, 2023b) and the data were re-branded to 3D Elevation Program (3DEP).
Along with the new branding, the endpoints of the respective web services changed, which lead to malfunctioning of our application (discussed below).
3.4 Google Maps Platform
We use the Maps JavaScript API offered by the Google Maps Platform (Google, 2023b) to display a background map, and the Places API to translate location names or addresses to geographic coordinates.
4 Application requirements
The application targets property owners, buyers, planners etc., who want to get a quick overview of flood risk in the neighbourhood of interest. Other possibly interested groups include the insurance industry and catastrophe risk managers.
The target user has possibly little experience with the interpretation of geophysical datasets. They want to access data stored in the National Storm Surge Risk Map and are looking for an easy way to view it. Tiled web maps such as the NHC's interactive viewer (NHC, 2023a) are easily accessible for most users and we set out to provide an alternative to this application.
The application should contain appropriate disclaimers regarding the accuracy and significance of the datasets.
5 Design
- The application is delivered through a web browser. After accepting the terms of service, a map of the U.S. mainland is loaded along with a map tile overlay showing contours of inundation depth for various hurricane categories.
- The user interacts with the map by zooming and panning. Picking a point on the map displays further information about the location.
- A point can be picked in two ways. Either by clicking on the location on the map, or by using the address bar to query Google's Places API. The return of the query contains a geographic coordinate for the picked point.
- A user can pick any point on the map, but downloading information for all points is not feasible, since the data set is too large. Therefore, whenever the user picks a particular point, only the data for the particular point of interest is downloaded. To this end, three asynchronous API queries are triggered to the following endpoints:
- our own Storm surge API endpoint which accepts a geographical coordinate and returns data from the four neighbouring grid cells of the NHC Risk Map
- FEMA's National Flood Hazard Layer WMS server endpoint
- USGS's National Elevation Dataset (now 3DEP) API endpoint
- The data returned from the API calls is displayed in pop-up tables on the map.
6 Implementation
6.1 Frontend
There are many tiled web map providers available, and Google maps was chosen because Google offers comprehensive and fast address lookups. Google does not charge developers unless the number of API calls exceed certain limits. Initially we considered using the Mapbox GL JavaScript library (Mapbox, 2023) as web map application in combination with vector tiles constructed from OpenStreetMap data (OpenStreetMap, 2023). Although this variant would not have featured an address lookup, the learning effect in the area of geospatial data processing would arguably have been greater. We pursue a similar strategy in the current implementation of the storm surge map (not shown).
The Google API allows displaying overlay map tiles on top of the base maps provided by Google. The NHC's GeoTIFFs were tiled with the gdal2tiles.py program, which is part of the (GDAL/OGR, 2023) tool set.
Typescript was used to program the web frontend. The compiled Javascript code was bundled with webpack 
6.2 Backend
We use the Amazon S3 
Amazon Aurora 
Access to the point data stored in the relational database is provided via the publicly accessible Storm surge API. Requests to the API are made by submitting the geographical coordinates of the picked point in the URL's query string. The requests are handled by a Python function that extracts the coordinates and sanitizes the input. It then retrieves the point data from the database and returns it to the API client in the form of a JSON object.
7 User Interface
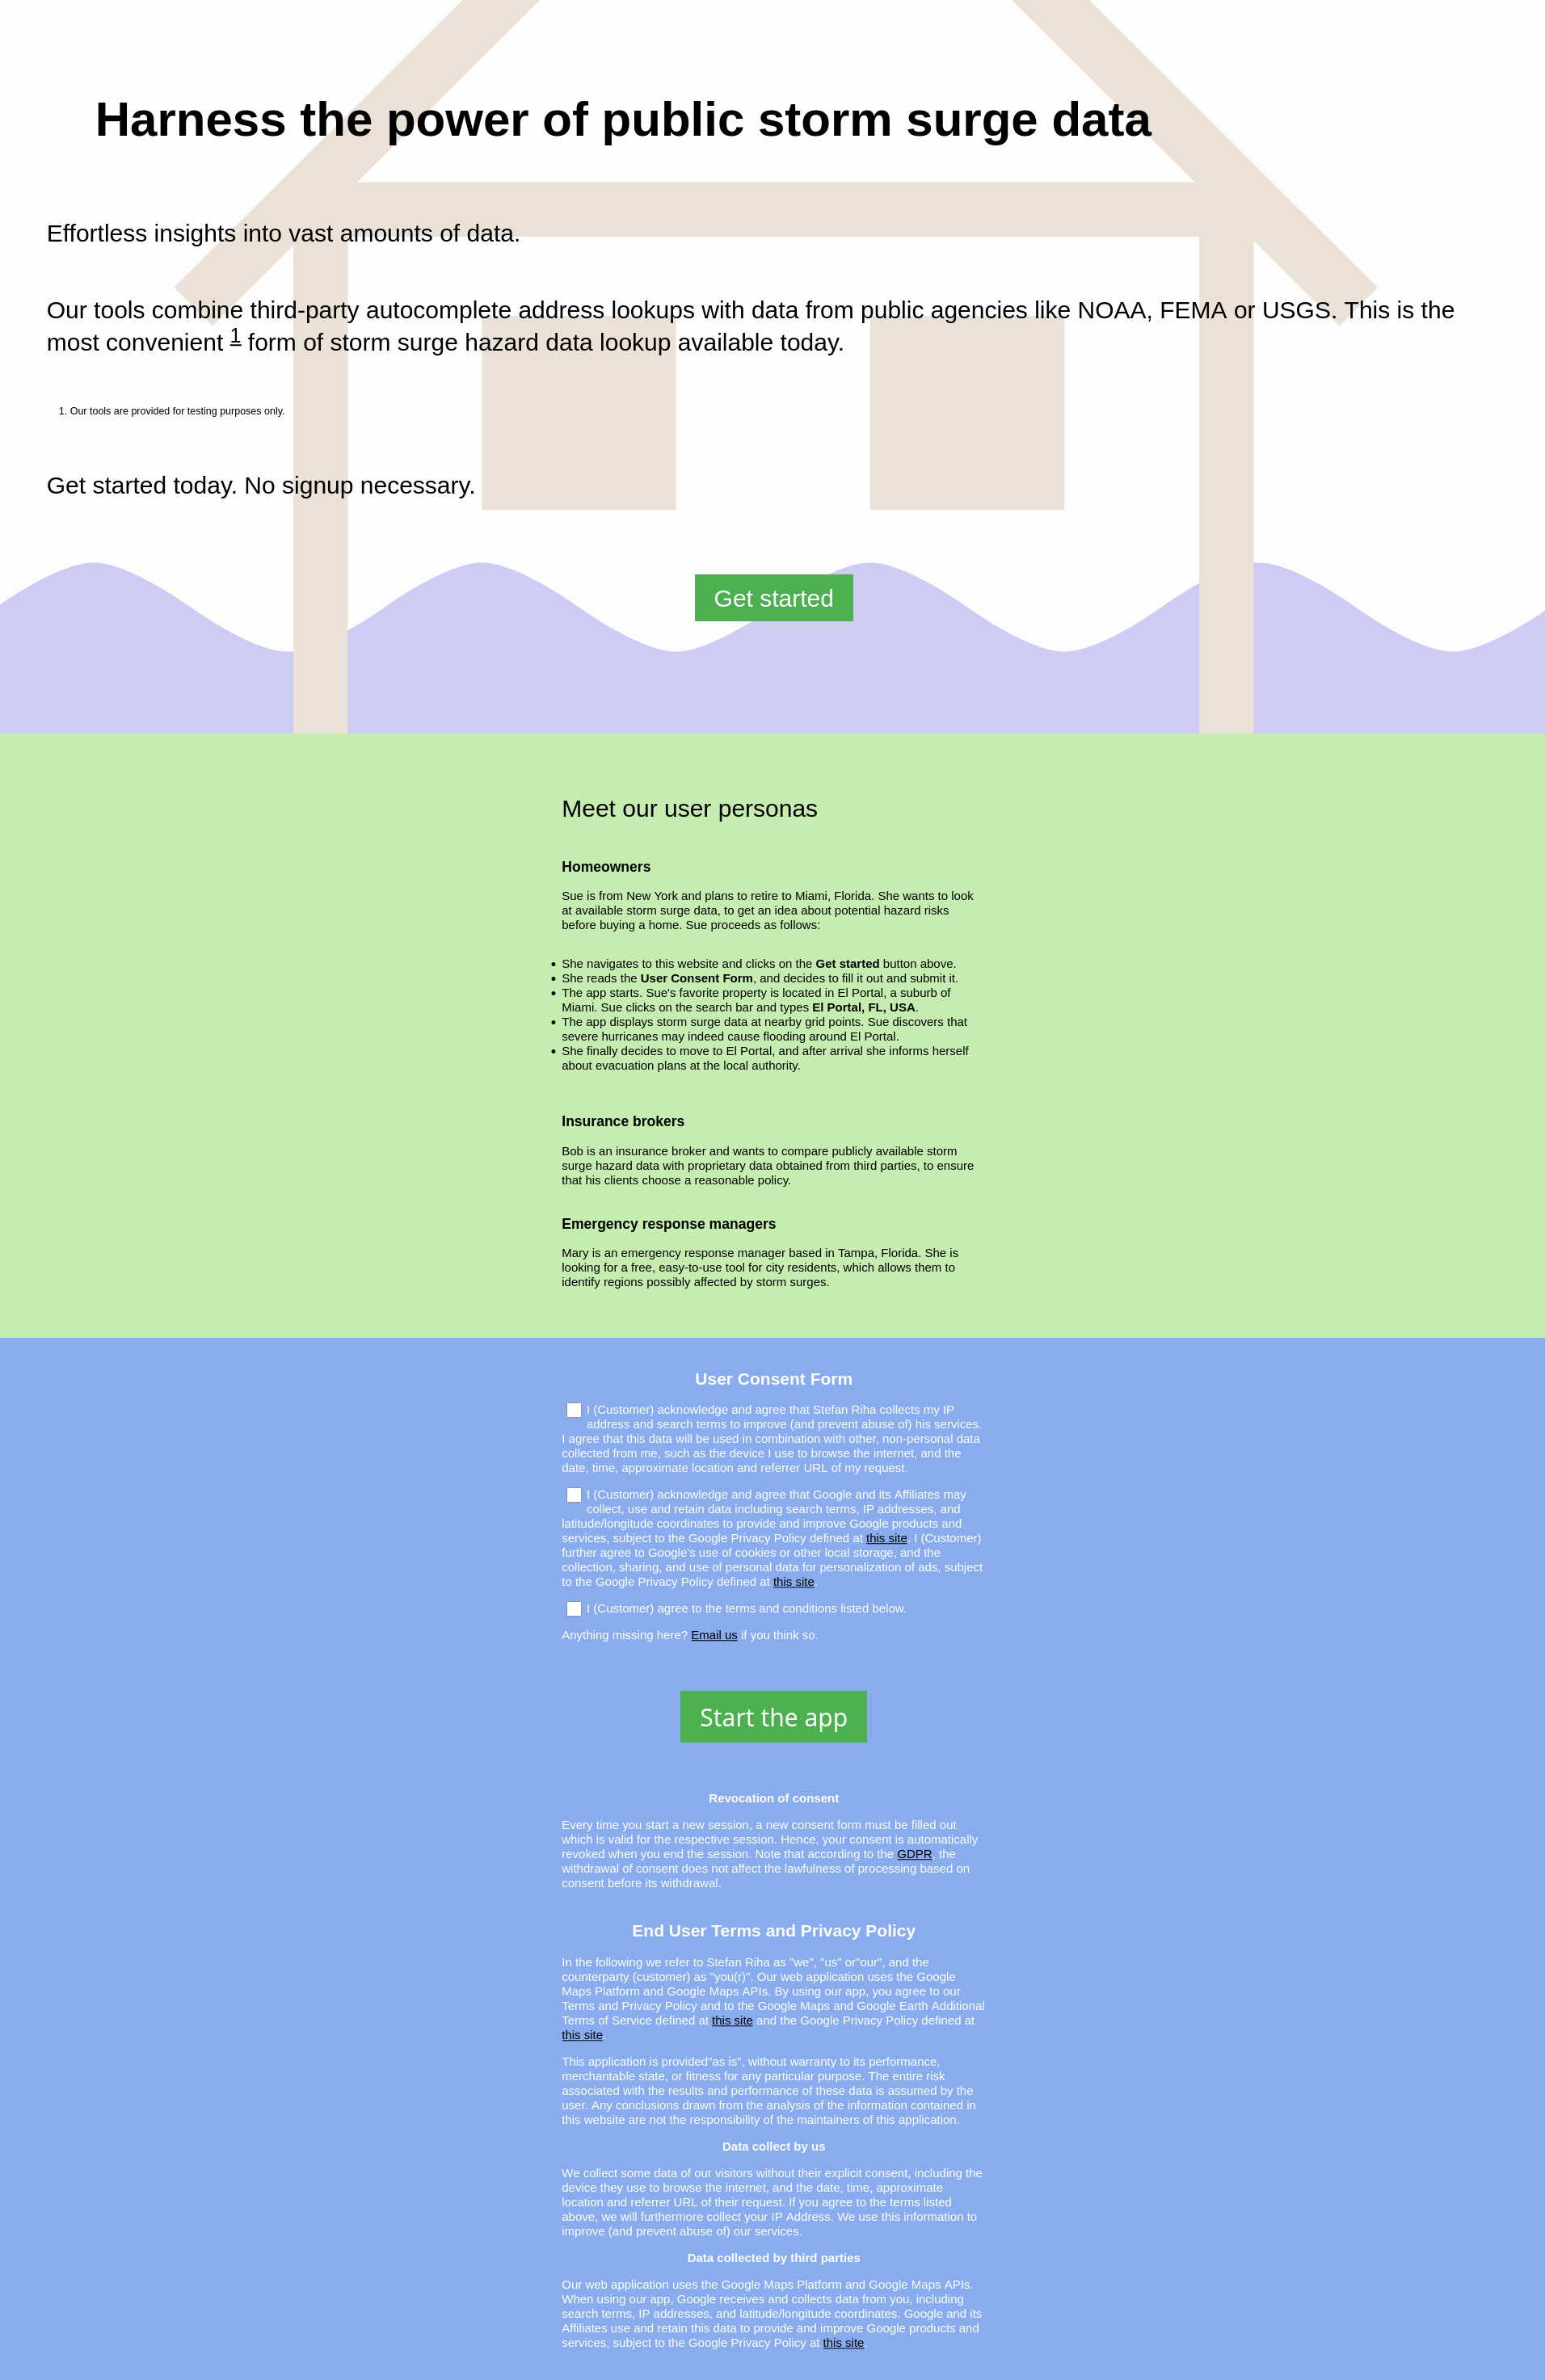
Figure 1 shows the landing page with three sections. The first section displays a logo in the background and a slogan with the purpose of persuading the user to further interact with the app. The second section describes the target users of the app. The third section lists a user consent form. A possibly problematic issue is the use of Google APIs and the associated data collection practices of a third party. Our use of Google products was the main reason we decided to implement a dedicated landing page. The landing page does not load Google's Javascript library. Only after the user's explicit consent, the library is appended to the HTML <head> element and loaded by the browser.
User interaction
-
Clicking the button labelled
Get startedscrolls to the user consent form. -
If the button labelled
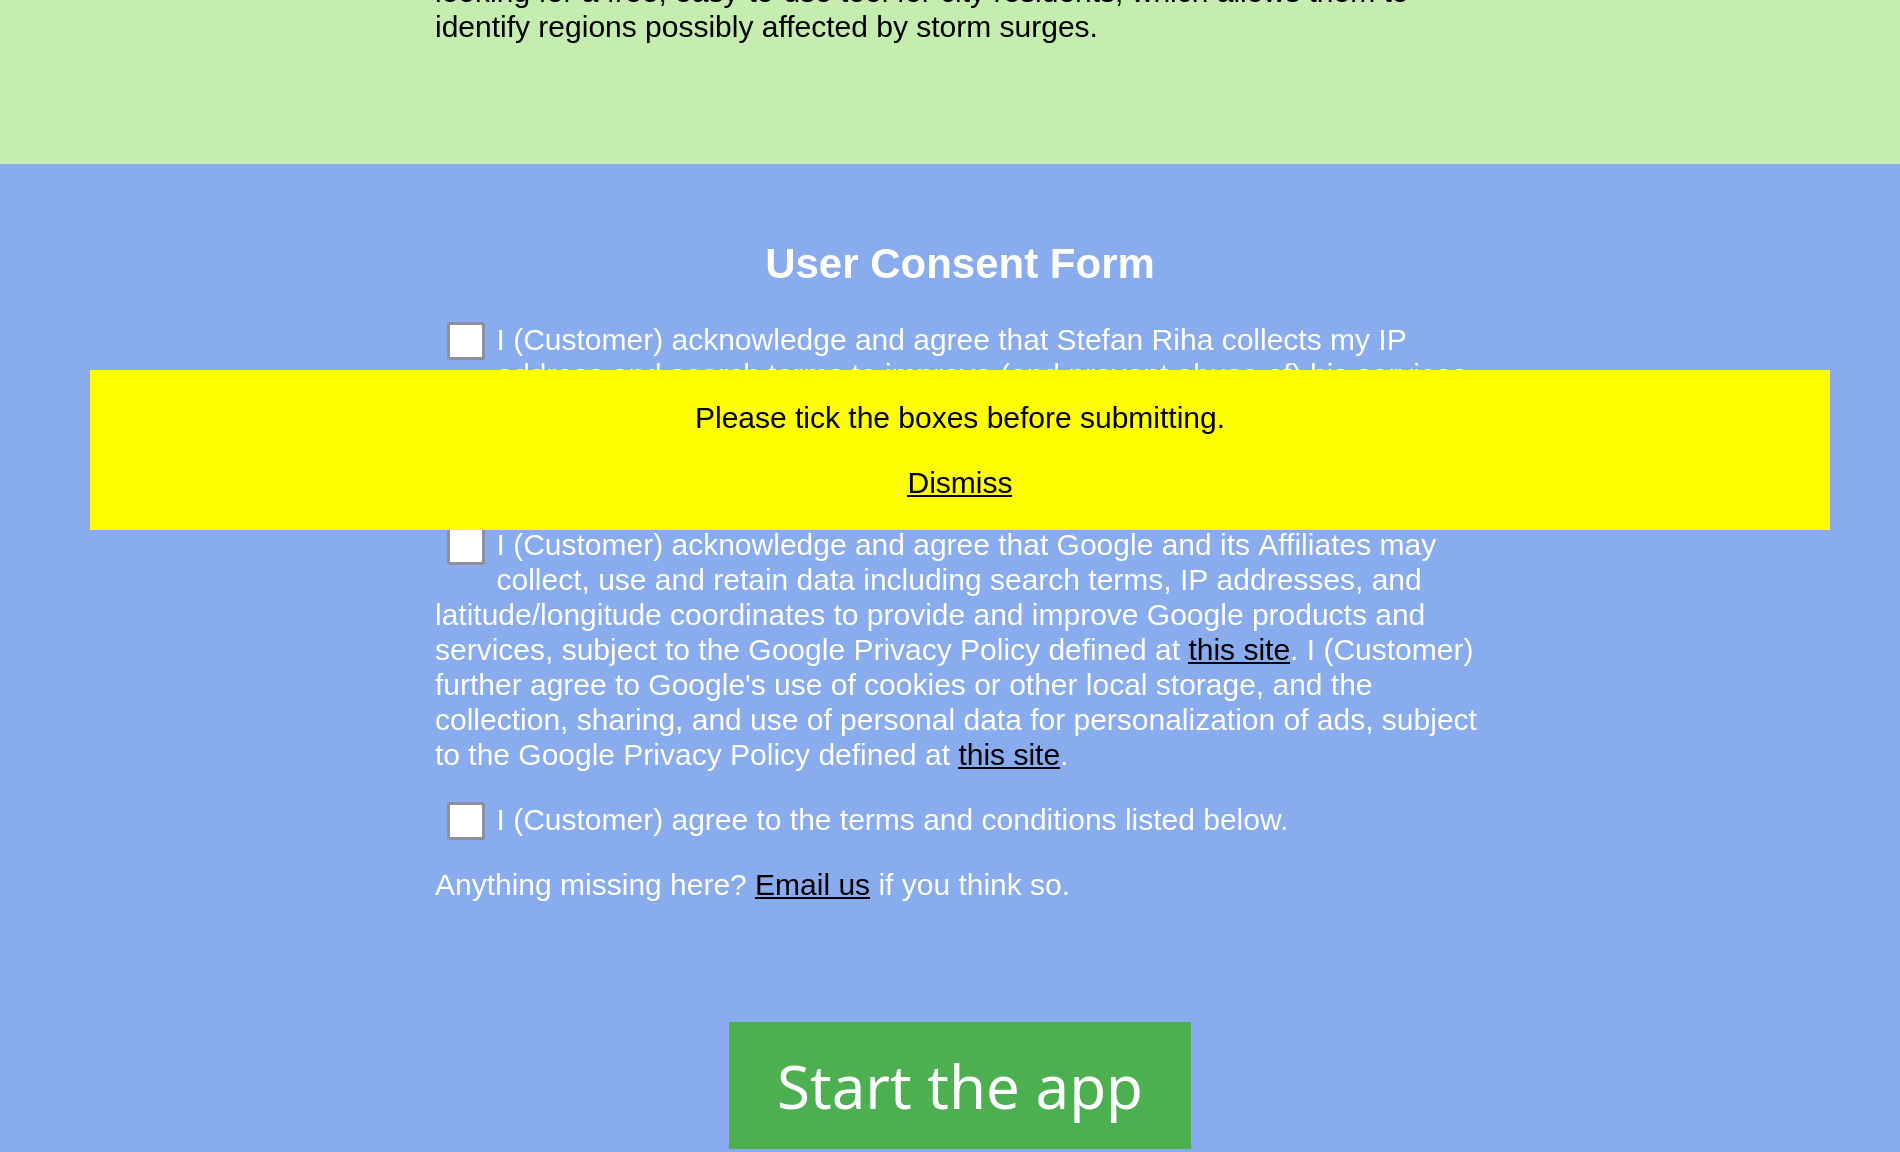
Start the appis clicked but not all consent boxes are ticked, a pop-up appears as shown in Figure 2. -
If the button labelled
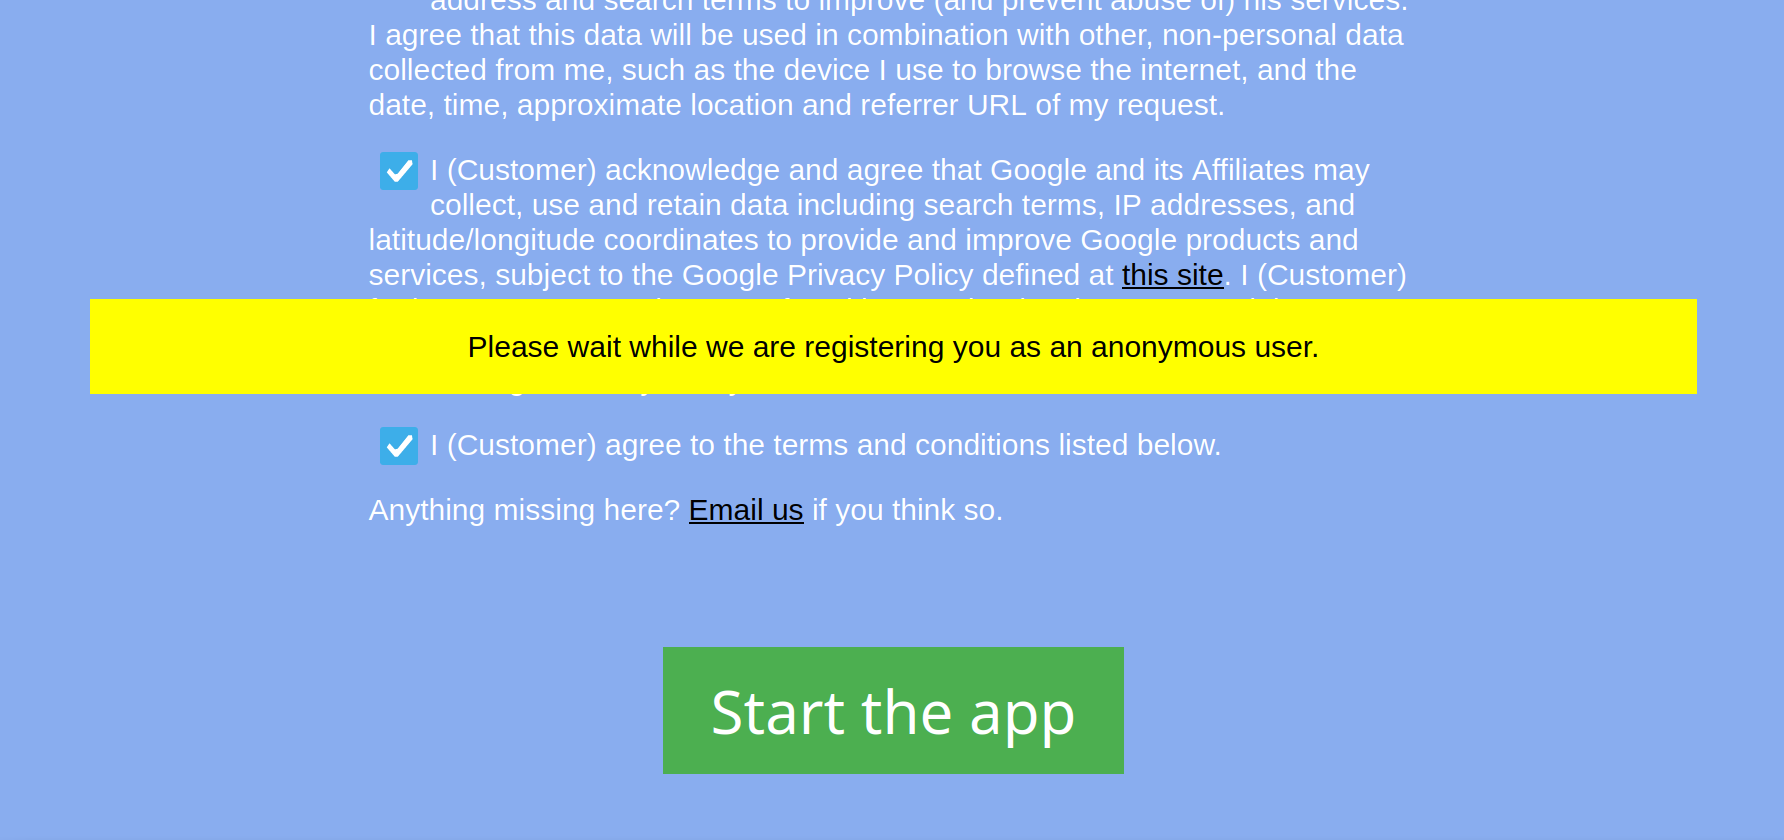
Start the appis clicked and all consent boxes are ticked, a pop-up appears as shown in Figure 3.
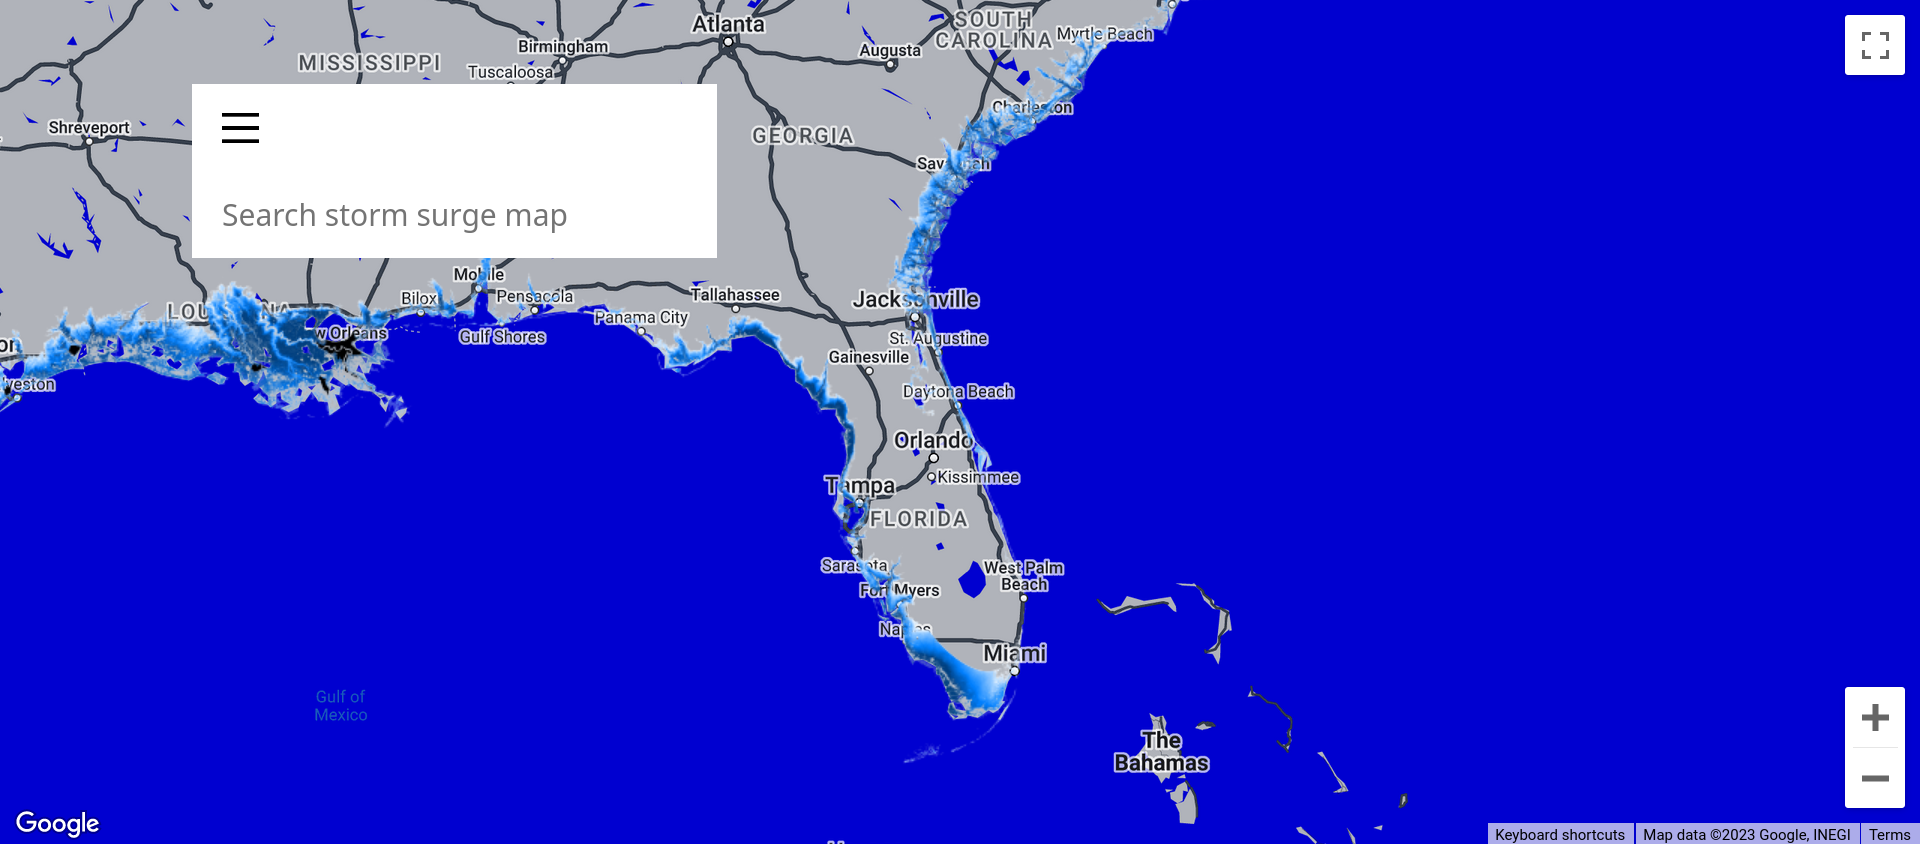
- Figure 4 shows the map after initializing. The familiar Google base map is styled in dark colors to increase the visibility of the flood map overlay. A toolbar features a menu button and a search box.
- Entering a search term triggers the API requests for point locations, as described above. To provide immediate user feedback, a popup appears to indicate that the request is in progress, as shown in Figure 5. Here we pick the point location "Miami Beach Convention Center", as displayed in the search bar in the figure.

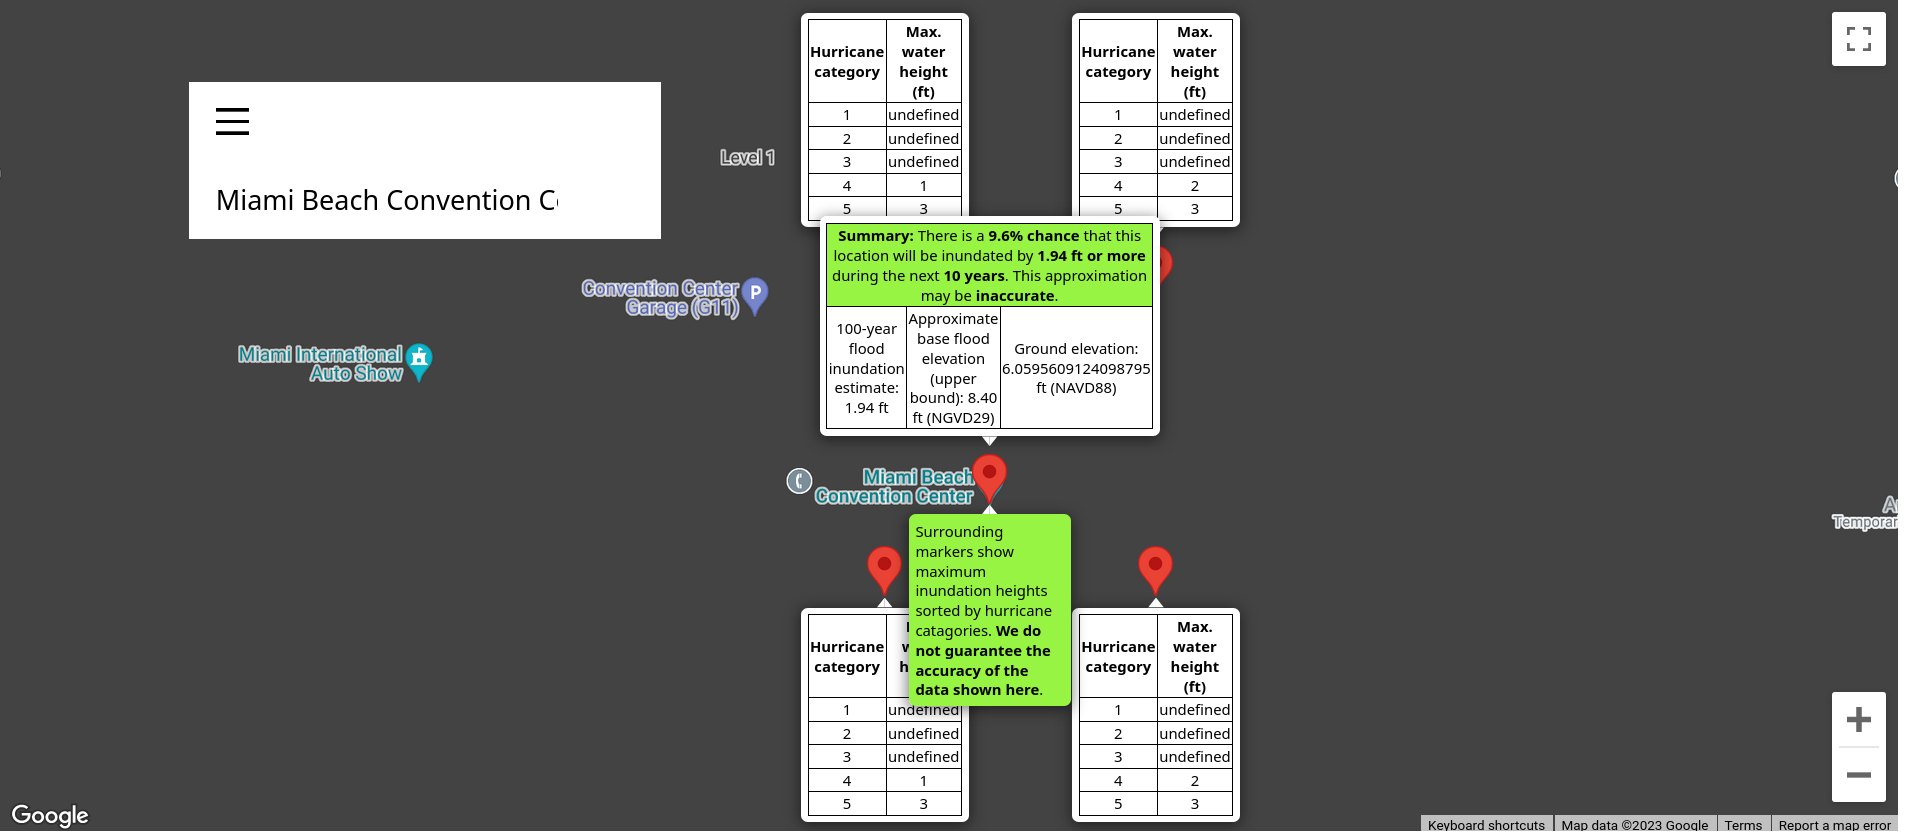
- The map zooms to the point location. Markers indicate the point location and the 4 surrounding grid points of the NHC National Storm Surge Risk Maps dataset, as shown in Figure 6. For each grid point, a table contains the estimated maximum water height for each hurricane category.
-
An additional table is attached to the point location, displaying data of the FEMA National Flood Hazard Layer and the USGS 3D Elevation Program data set. Because of the numerical rounding used to produce Flood Insurance Rate Maps,
FEMA (2005) suggests (in their section 4-6) to add 0.4 foot to base flood elevations (BFE) in coastal areas. For example, the BFE in the example is 8 ft, and the table lists 8.4 ft as the "upper bound" of the BFE, along with the vertical datum (National Geodetic Vertical Datum of 1929, or NGVD29). The ground elevation data in the example is 6.06 ft with respect to the North American Vertical Datum of 1988 (NAVD88). The estimate of the 100-year flood is calculated by subtracting the the numerical value of the ground elevation from the BFE. There seems to be a bug in our application, because the numbers should be converted to the same vertical datum before subtracting them. Using the NGS Coordinate Conversion and Transformation Tool (NCAT)
provided by the U.S. National Geodetic Survey (NGS, accessed Oct. 17, 2023), 8 ft NGVD29 correspond to 6.45 ft NAVD88 at the Miami Beach Convention Center. Conversion numbers for the surrounding neighbourhoods can also be found in the preliminary Flood Insurance Study (FIS) reports for Miami-Dade County, which can be downloaded from the FEMA Flood Map Service Center
(accessed Oct. 17, 2023). Their Table 19 in Volume 2 of the study lists countywide vertical datum conversion "factors" for various regions in the county, which are comparable in magnitude to what the NCAT tool yields at the specific location of the convention center. Variations of the difference between NGVD29 and NAVD88 across the U.S. can be seen in a map
by the NGS (accessed Oct. 17, 2023). According to this map, it seems that our application overestimates the inundation depth associated with the 100-year flood along the entire U.S. East Coast.
- The table furthermore shows the exceedance probability for a 10-year period, using the formula
- where \(p_n\) is the probability that one or more floods exceed the flood with annual exceedance probability \(p\) in a period of \(n\) years (USGS, 2019, their Eq. 1).
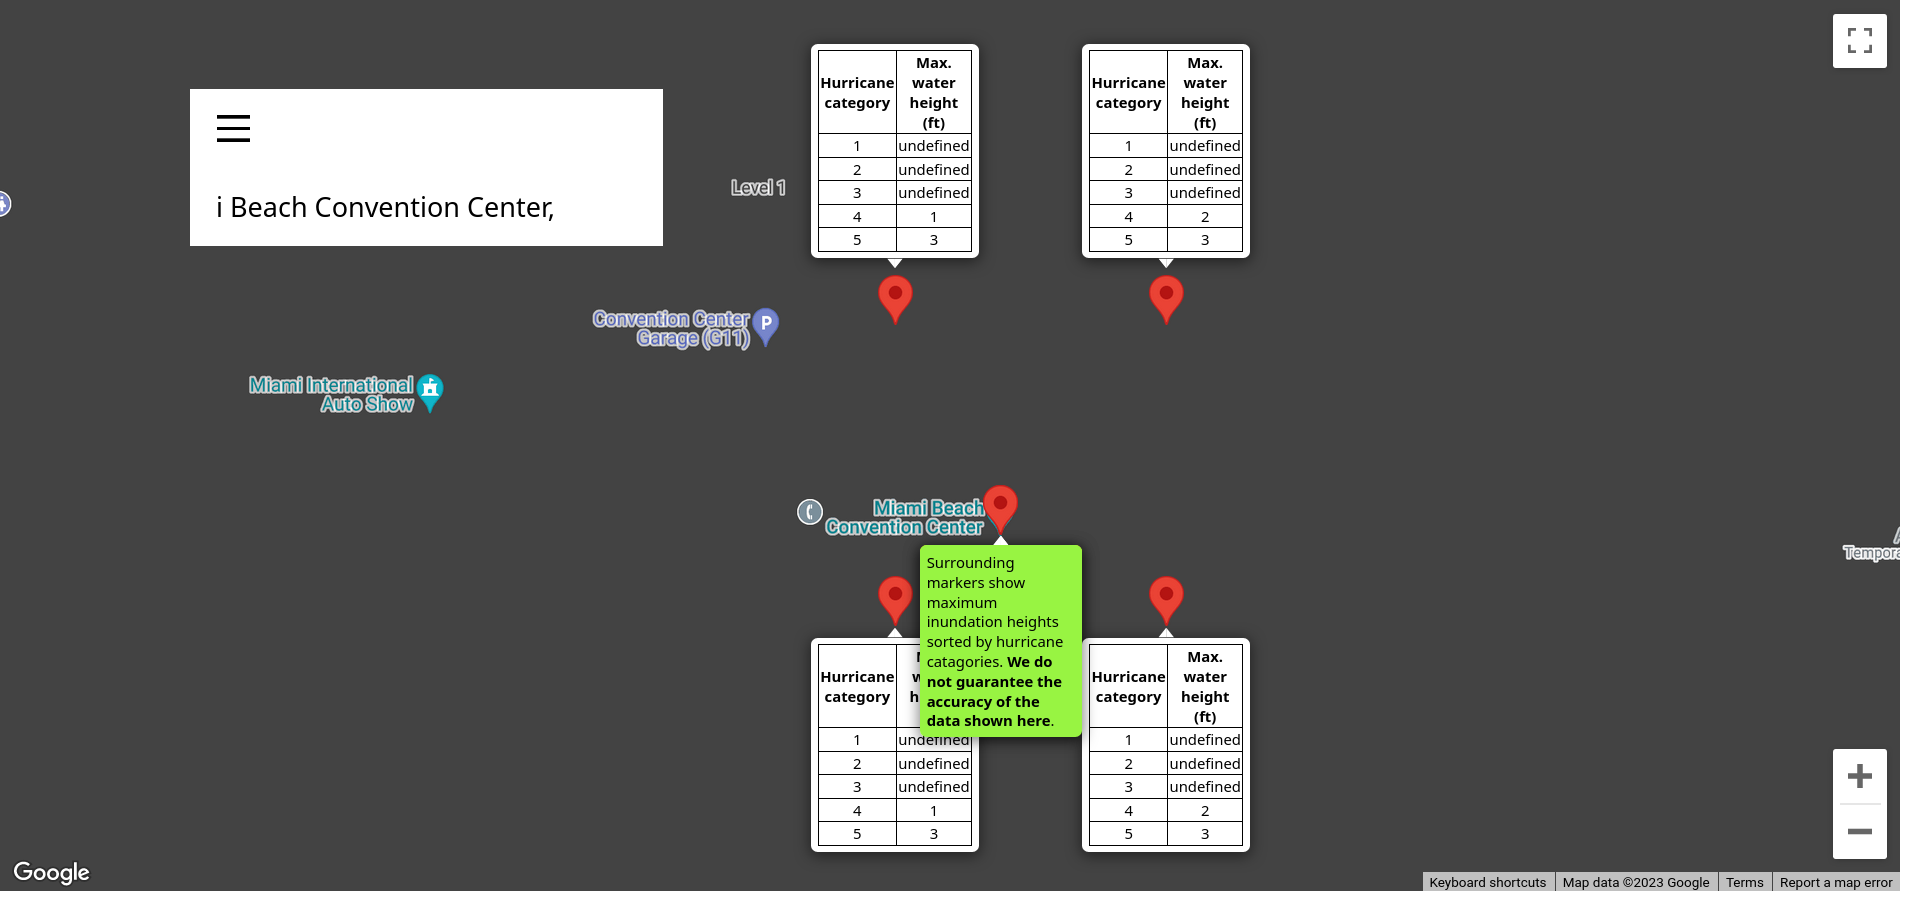
- In case either one of the APIs provided by FEMA or USGS does not send a reply, the table with the base flood estimates is not shown, as in Figure 7.
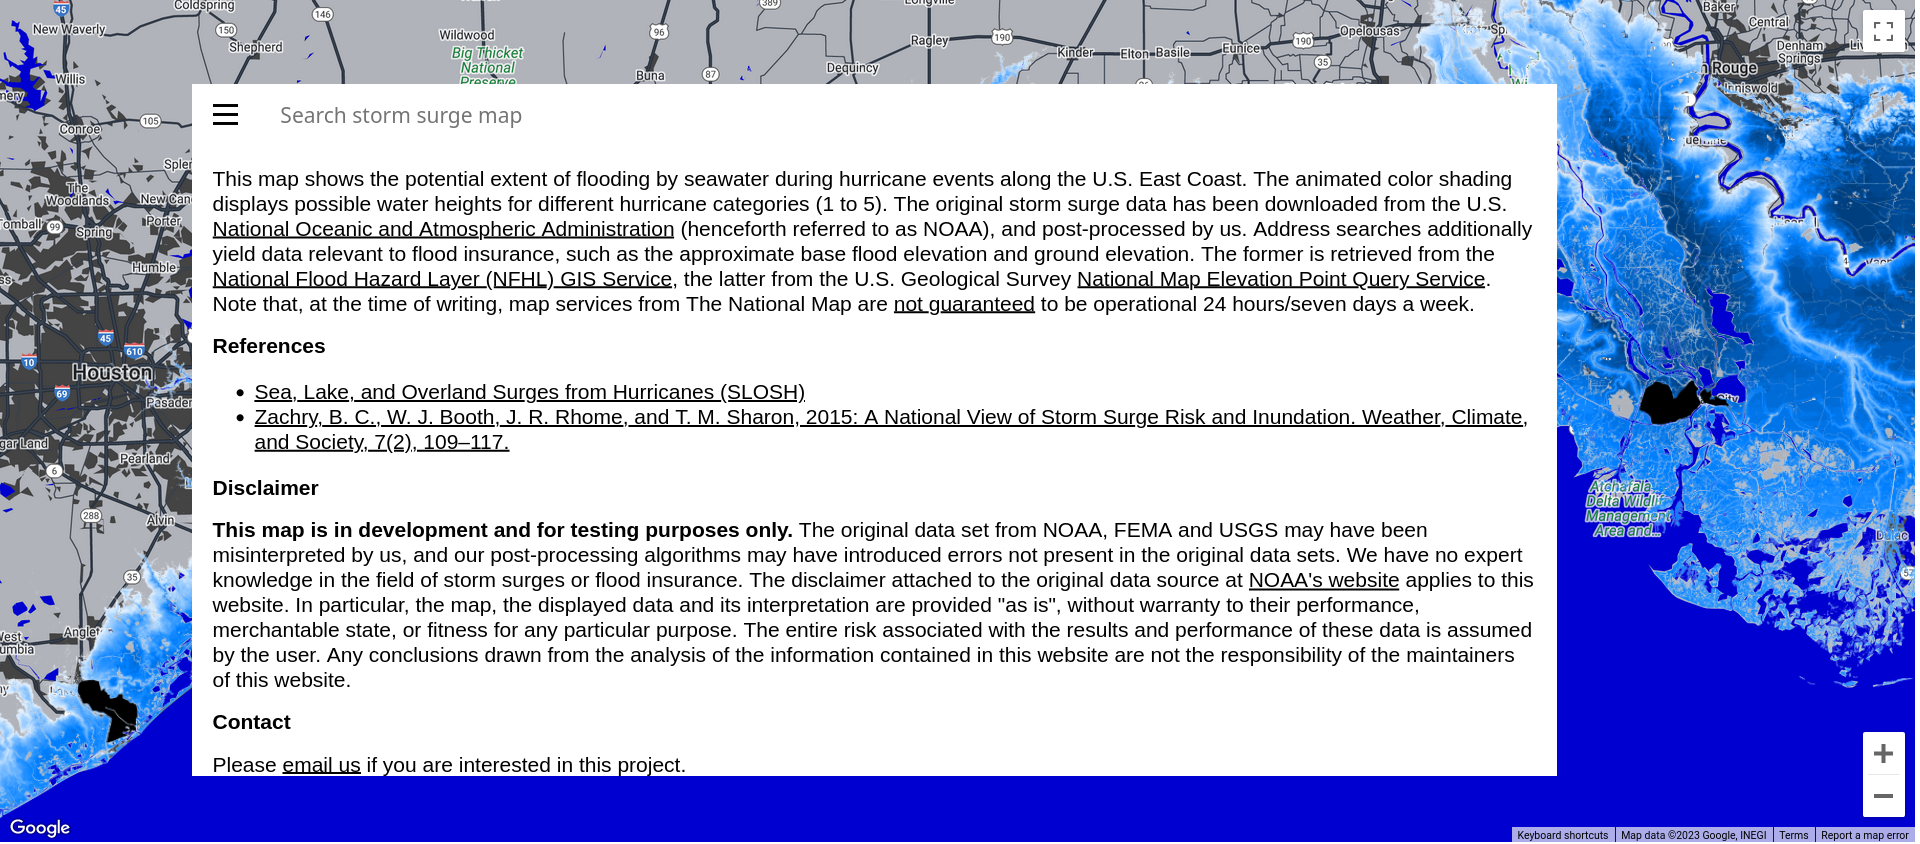
- Clicking on the menu button in the search box reveals a text box with a description of the datasets, a reference to Zachry et al. (2015), and finally a disclaimer that the map is not ready for production use.
7.1 Licenses
We assume that the SLOSH dataset is considered a U.S. Government Work and in the public domain, given that we have not found any information on copyright or licensing. Most government creative works are copyright-free 

The field Copyright Text in the data structure of the NFHL map server (FEMA, 2023c) is empty. We assume that the data is in the public domain.
All 3DEP products are public domain (USGS, 2023c) and are available free of charge and without use restrictions (USGS, 2023a).
Google's terms of services are listed in Google (2023a).
8 Lessons learned
- During deployment of the application, USGS deprecated the API endpoint we used, which limited the functionality of our application. When relying on third-party APIs, they should be continuously monitored and exceptions should be handled appropriately. In hindsight it may seem obvious that the design of continuous monitoring functions for webservices is as important as the design of the service itself.
-
We forgot to implement vertical datum conversion, which led to an incorrect estimate of the flood inundation depth associated with the 100-year flood. The conversion could be implemented via another third-party API call, perhaps using the NGS Coordinate Conversion and Transformation Tool (NCAT)
service. While the accuracy and significance/interpretation of geophysical data has played a minor role in this project (which was mostly concerned with learning methods of "web-" programming), the oversight shows that it is important to insert prominent disclaimers. This may be especially true for products targeted at end-users.
- Taking a more general perspective, the programming of this specific application provided valuable experiences for other tasks, e.g. the construction of web application programming interfaces (APIs) to give application developers programmatic access to geophysical data. Skills for frontend development are useful for presentation in general, and in particular for near real-time content and data visualization. Such content is typically consumed on web pages rather than PDF documents, and is by its nature ephemeral, at least to some extent. However, while PDF seemingly remains the format of choice for more "longevous" content such as scientific publications and technical documentation, we suspect that the amount of publications that are actually printed on paper steadily decreases. So long as the content is viewed on a screen, web pages and other formats such as EPUB seem to have certain advantages over PDF, such as variable font size and reflowable layout.
- Learning about geospatial/GIS applications (GDAL/OGR, QGIS, etc.) in the context of the web map was helpful for other tasks. For example, we started to use geospatial/GIS applications for the construction of grids for numerical model simulations, in particular for defining the boundary of the grids. QGIS can provide valuable insights into a modelling domain by displaying all kinds of relevant data, such as bathymetry or locations of instruments like drifting buoys, profiling floats, moorings, etc.
9 Further developments
Our daily work involves a significant amount of computer system administration. While "the cloud" offers great services, we work mostly in "traditional" operating environments such as Linux, installed directly on physical machines. To learn more about system administration, we temporarily move our current infrastructure to dedicated "bare-metal" servers. Given that the web map relies on services like AWS Aurora, it must either be retired or restructured. Restructuring the app offers the opportunity to work with self-hosted web maps and databases. However, the project has low priority and progress may be slow.
References
- Esri, 2023: ArcGIS website. Accessed Oct. 6, 2023
- GDAL/OGR contributors, 2023: GDAL/OGR Geospatial Data Abstraction software Library. Open Source Geospatial Foundation.
- Google, 2023a: Google Maps Platform Terms of Service. Accessed Oct. 6, 2023
- Google, 2023b: Google Maps Platform. Accessed Oct. 6, 2023
- Mapbox, 2023: Mapbox | Maps, Navigation, Search, and Data. Accessed Oct. 6, 2023
- OpenStreetMap contributors, 2023: Planet dump retrieved from https://planet.osm.org.
- U.S. Federal Emergency Management Agency (FEMA), 2005: National Flood Insurance Program (NFIP) Floodplain Management Requirements: A Study Guide and Desk Reference for Local Officials. Accessed 2023/10/13
- U.S. Federal Emergency Management Agency (FEMA), 2023a: GIS Web Services for the FEMA National Flood Hazard Layer (NFHL). Accessed Oct. 6, 2023
- U.S. Federal Emergency Management Agency (FEMA), 2023b: National Flood Hazard Layer. Accessed Oct. 6, 2023
- U.S. Federal Emergency Management Agency (FEMA), 2023c: public/NFHLWMS (MapServer). Accessed Oct. 6, 2023
- U.S. Geological Survey (USGS), 2019: Guidelines for determining flood flow frequency. Bulletin 17C. (Accessed Oct. 17, 2023)
- U.S. Geological Survey (USGS), 2023a: About 3DEP Products and Services. Accessed Oct. 6, 2023
- U.S. Geological Survey (USGS), 2023b: The National Elevation Dataset. Accessed Oct. 6, 2023
- U.S. Geological Survey (USGS), 2023c: USGS 3D Elevation Program (3DEP) Datasets from The National Map. Accessed Oct. 6, 2023
- U.S. National Hurricane Center (NHC), 2023a: ARCGIS interactive map viewer for the National Hurricane Center Storm Surge Risk Maps. Accessed Oct. 6, 2023
- U.S. National Hurricane Center (NHC), 2023b: National Storm Surge Risk Maps. Accessed Oct. 6, 2023
- U.S. National Hurricane Center (NHC), 2023c: Sea, Lake, and Overland Surges from Hurricanes (SLOSH). Accessed Oct. 6, 2023
- Zachry, B.C., Booth, W.J., Rhome, J.R., Sharon, T.M., 2015: A national view of storm surge risk and inundation.