Notes on NCEP-NAM ocean winds during hurricane Sandy
Riha, S.1 Abstract
We compare sea surface wind data of hurricane Sandy generated by the
North American Mesoscale Forecast System 

2 Introduction
This is a collection of figures characterizing NAM sea surface wind fields in the northern U.S. East Coast during the occurrance of Hurricane
Sandy. The NAM model is operated by the
National Centers for Environmental Prediction 

NAM wind products have been used by several authors studying hurricane Sandy:
-
Beudin et al. (2017) study the hydrodynamic and sediment transport response of Chincoteague Bay
(VA/MD, USA) to hurricane Sandy using the Coupled Ocean-Atmosphere-Wave-Sediment-Transport
(COAWST) modeling system. They force their model with wind velocity, air pressure, and solar radiation extracted from NAM (12 km resolution).
-
The
Stevens Institute of Technology’s New York Harbor Observing and Prediction System model
(NYHOPS) extracts its surface boundary conditions for winds and atmospheric heating and cooling from NAM ( Georgas and Blumberg 2009; Orton et al. 2012). Georgas et al. (2014) note some limitations of NAM for simulations of hurricane Sandy.
-
The Engineer Research and Development Center
provided post-Sandy modeling support in collaboration with the ADCIRC Surge Guidance System (ASGS) using NAM forcing with ADCIRC
(Massey et al., 2012).
- Jenkins (2015) investigates surface gravity waves in the Delaware Bay and adjacent coastal region using COAWST forced with NAM wind.
- Paim Ferraz Rodrigues (2016) simulate hurricane Sandy with a modeling framework for storm surge studies at Delaware bay, building on the work of Jenkins (2015). They state that NAM underestimates an observed peak wind speed of 25 m/s by up to 10 m/s, which leads to inaccurate surge height predictions.
In this post we use the NAM Analyses (NAM-ANL) product at roughly 12 km resolution. At the time of writing, the data records are available from March 3, 2004 to the present, and wind data is output 4 times daily at standard synoptic times (00:00, 06:00, 12:00, 18:00 UTC).
3 Methods
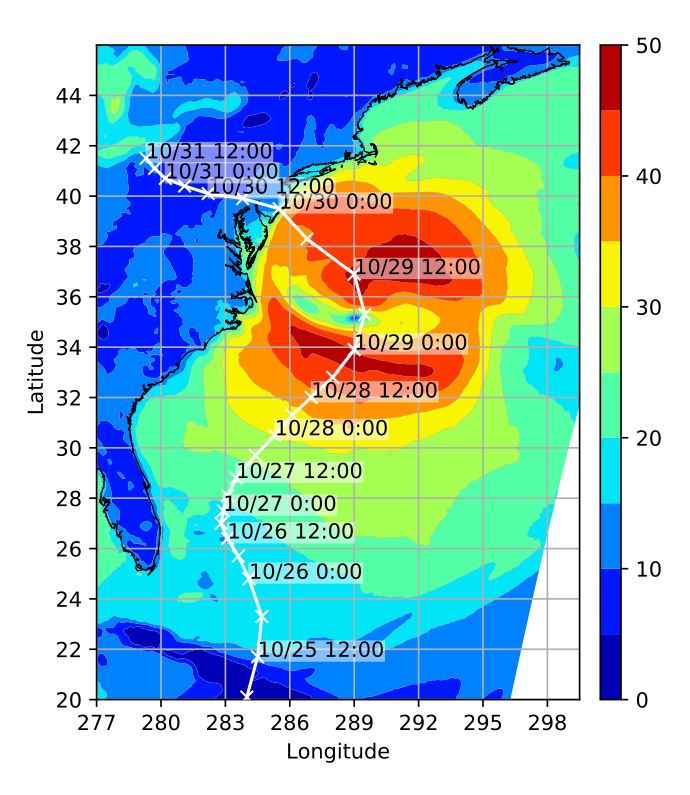
We compare the NAM wind to observations during the interval from October 25, 2012 at 12:00 UTC, to October 31 at 6:00
UTC, covering an interval of 5 days and 18 hours. Figure 1
shows 6-hourly hindcast track positions of hurricane Sandy from the
Tropical Cyclone Extended Best Track Dataset (EBTR) 
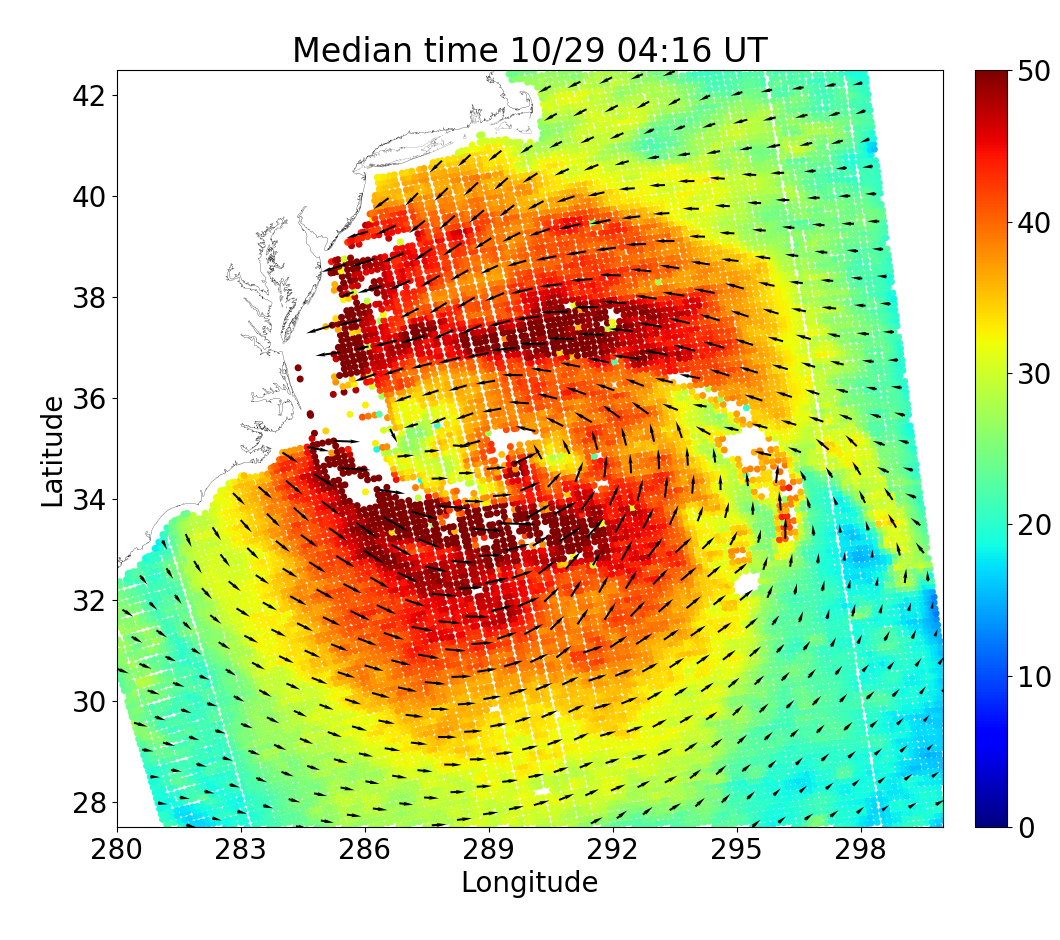
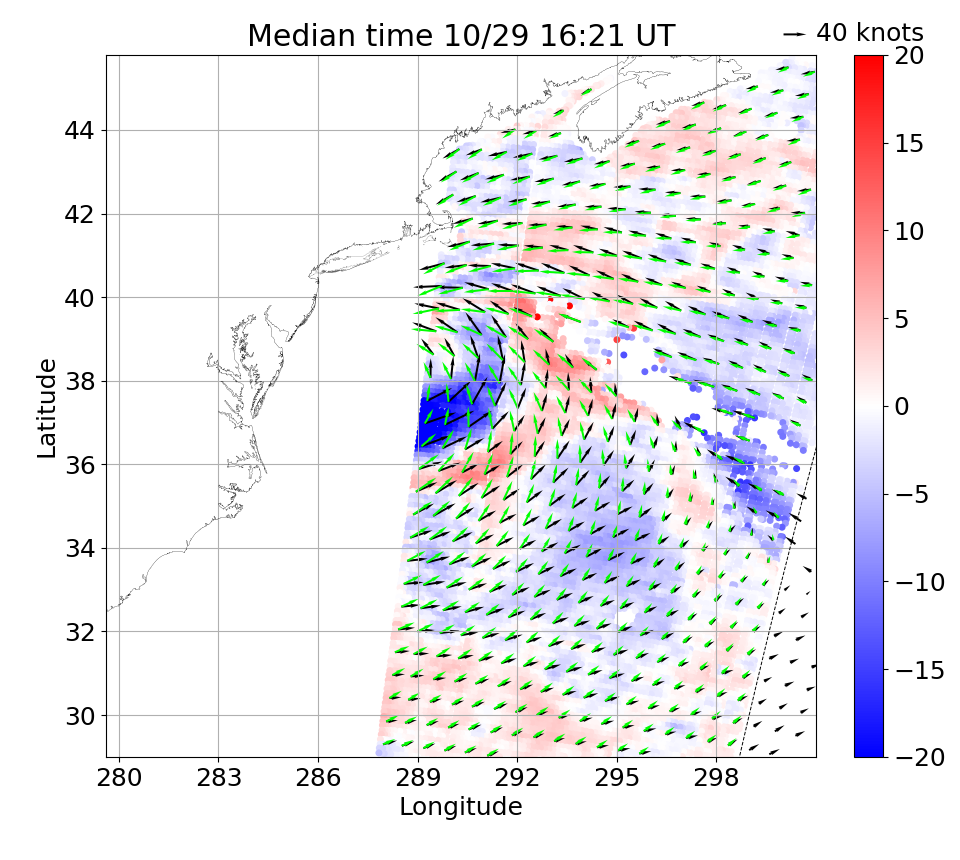
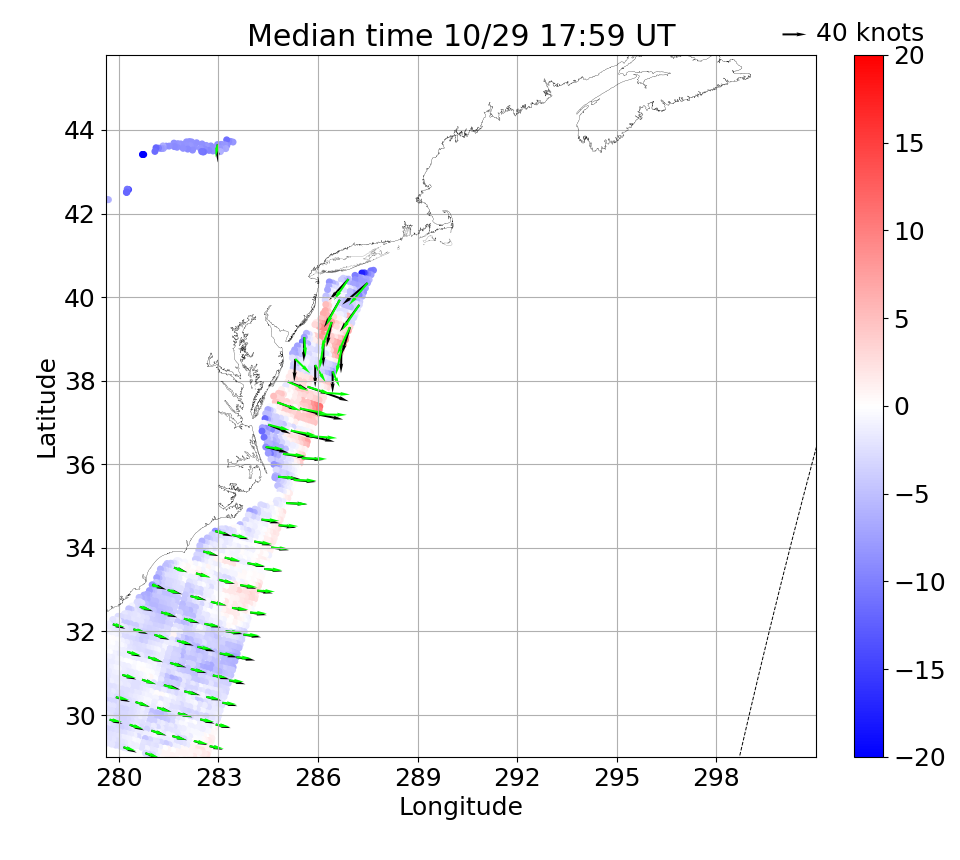
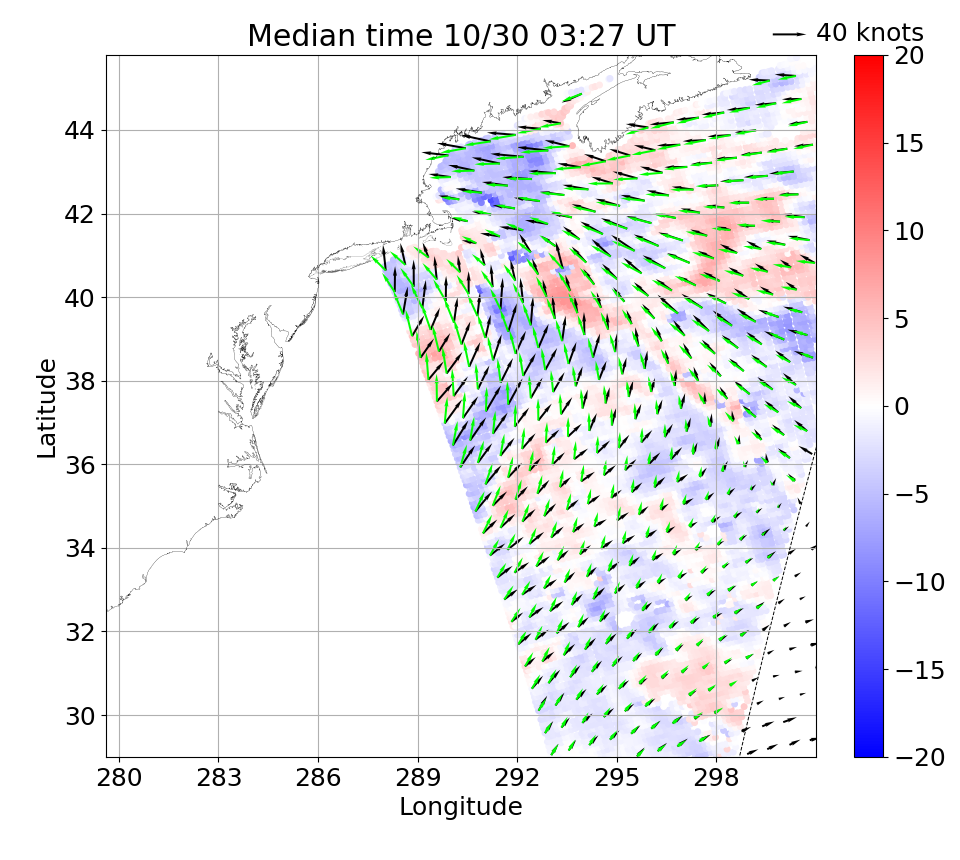
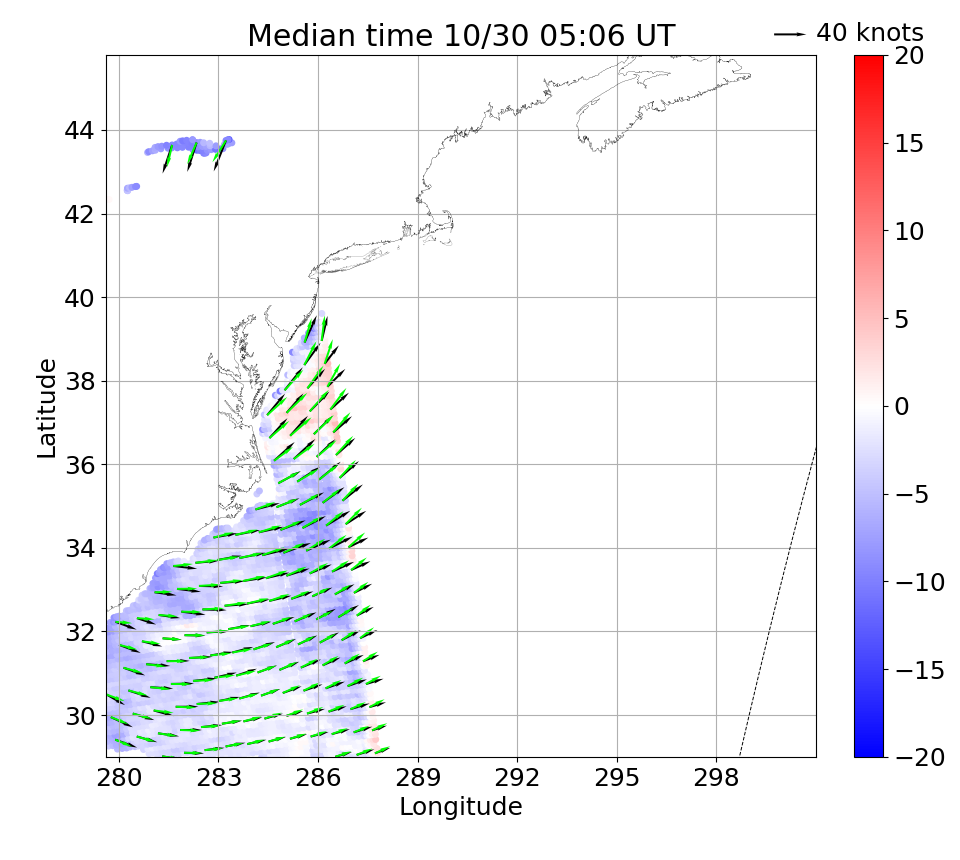
Below we compare the NAM wind to the surface wind field measured by the Oceansat-2 scatterometer (Jaruwatanadilok et al., 2014). Figure 2 shows an example wind field observed on October 29, 2012. The wind vector cells composed by the product shown are 12.5 km wide. For the products with coarser resolution (25 km and 50 km), KNMI (2017) state that the measurable wind speed range is from 0-50 m/s (~0-97 knots), and that wind speed estimates above 25 m/s (~49 knots) are less reliable. After a first quick look through the documentation, we are unaware of any temporal smoothing induced by the scatterometer inverse model. The wind vector cells composed by the scatterometer model are 12.5 km wide, which implies some spatial smoothing of instantaneous velocity data.
Below we also use wind speed recorded on buoys registered at the
NDBC. Figure 3 shows a map of the subset of
buoys in the region which supplied wind data between October 25 and October 31, 2012.
NDBC provides
averaged wind direction and wind speed measured by the buoy anemometer(s). The data
is averaged 

 .
Labels show station IDs printed in small fonts to avoid overlapping. This figure is a vector graphic and allows arbitrary zoom
levels without loss of resolution.
Wind data for use in stress parameterizations is usually given at a standard height of 10 m. Hence, wind measured at
anemometer height has to be adjusted to 10 m. At the time of writing, we were not able to find adjusted wind speeds
for the interval/region of interest after searching through
the respective folder 


to solve for \(u^*\) given \(U(z_{an})\), where \(z_{an}\) is the anemometer height, \(z_0\) is a roughness length, \(\alpha\) is the Charnock parameter (Charnock, 1955), \(k\) is the von Kármán constant \((k=0.41)\) and g is the gravitational acceleration. The Charnock parameter is set to \(\alpha=0.018\). The function \(U\) is then evaluated at \(z=10\). We are currently not yet certain if this approach is appropriate for data retrieved during a hurricane. In particular, the choice of \(\alpha\) is typically interpreted to be dependent on the sea state, e. g. the age and slope of the dominant wave length. Fairall et al. (1996) write that previous authors have used values for \(\alpha\) between 0.01 and 0.035. Hersbach (2011) writes that the commonly used range of \(\alpha\) is from 0.01 (for swell) up to 0.04 (for steep young ocean waves). He states that values up to 0.1 are used in extreme cases, and that a typical value is 0.018. Further literature review is necessary.
4 Results
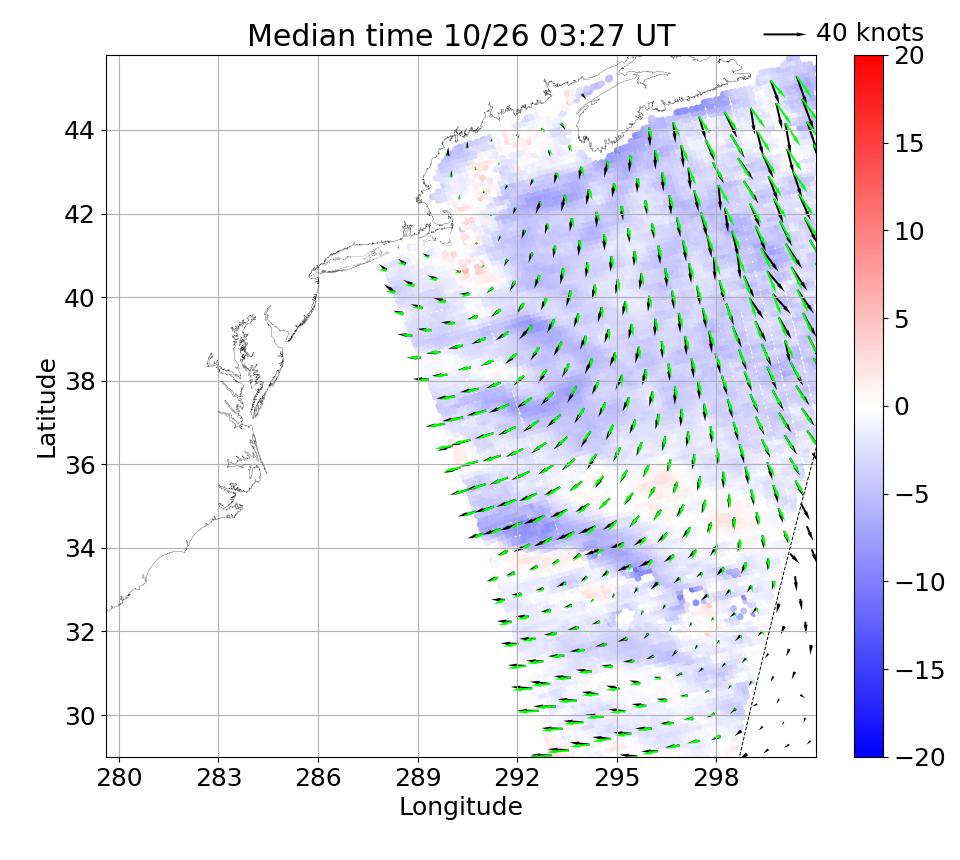
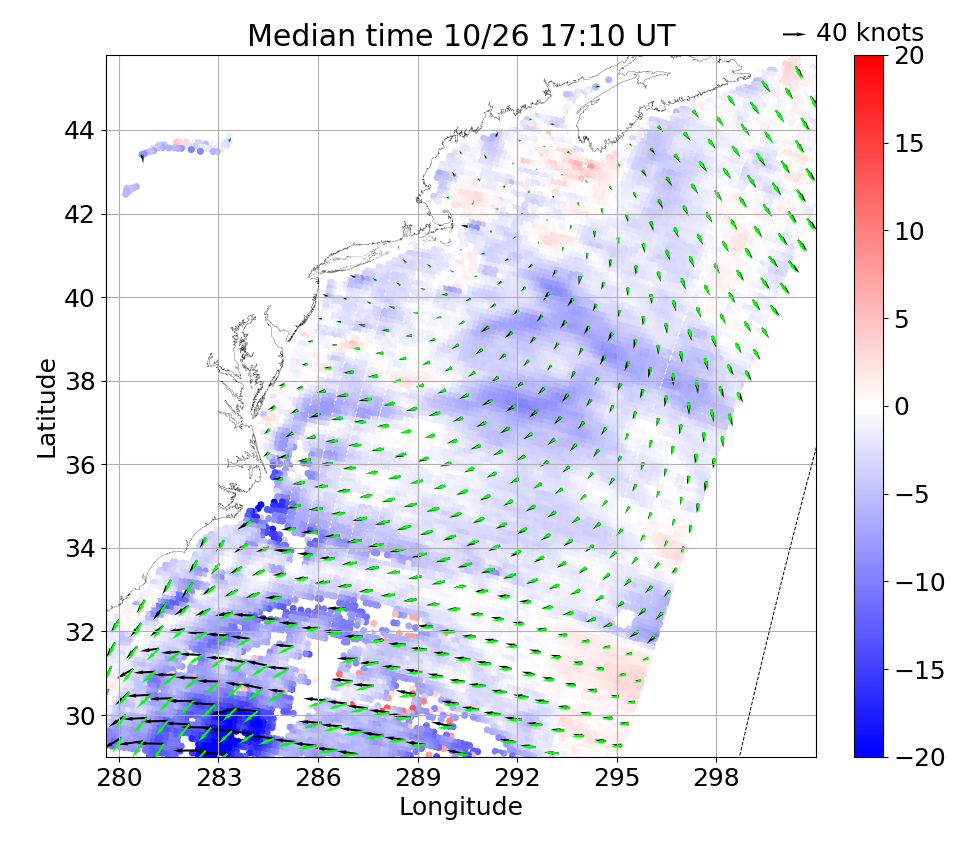
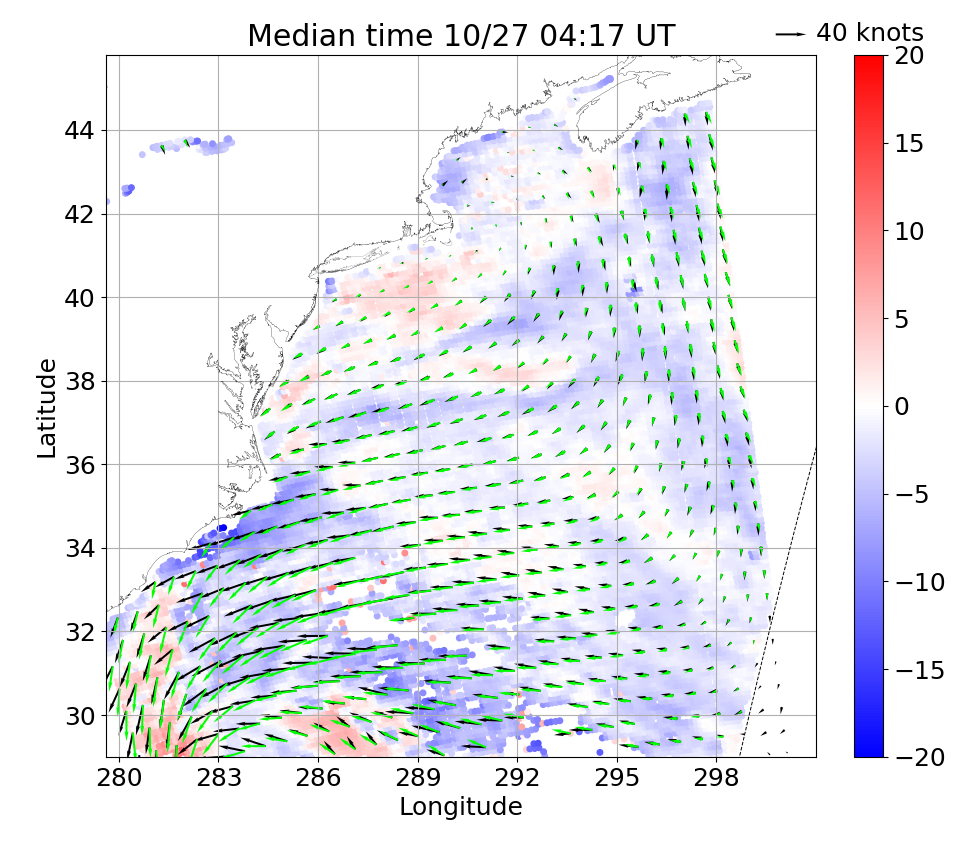
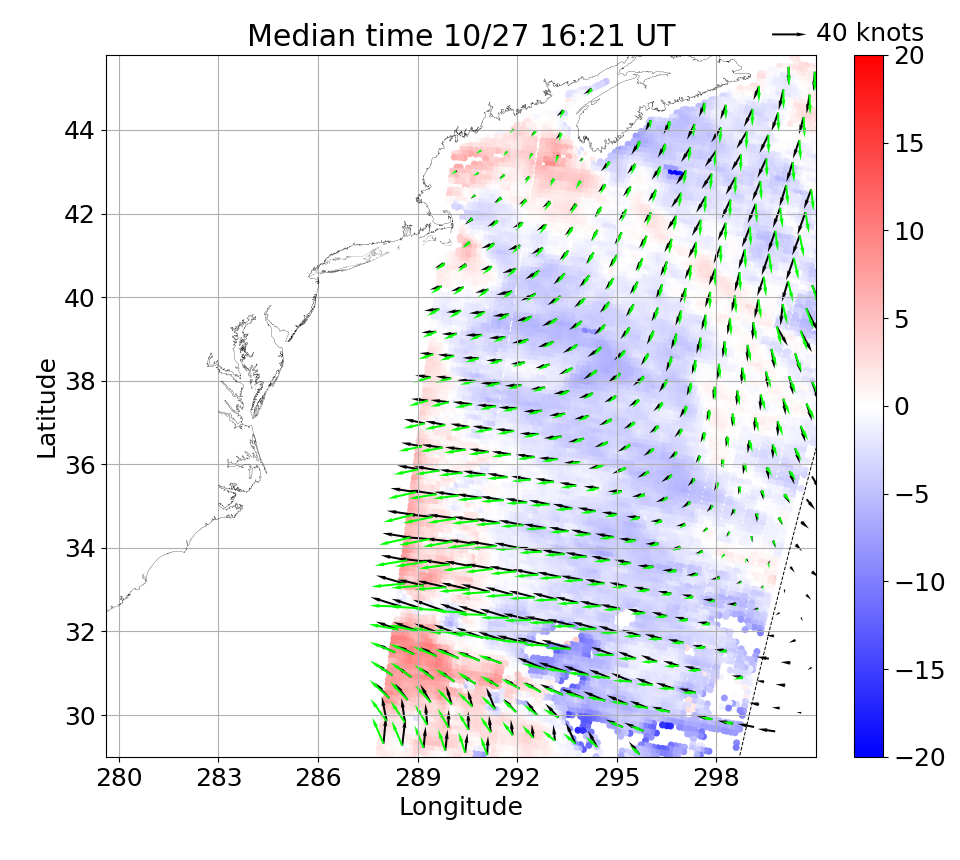
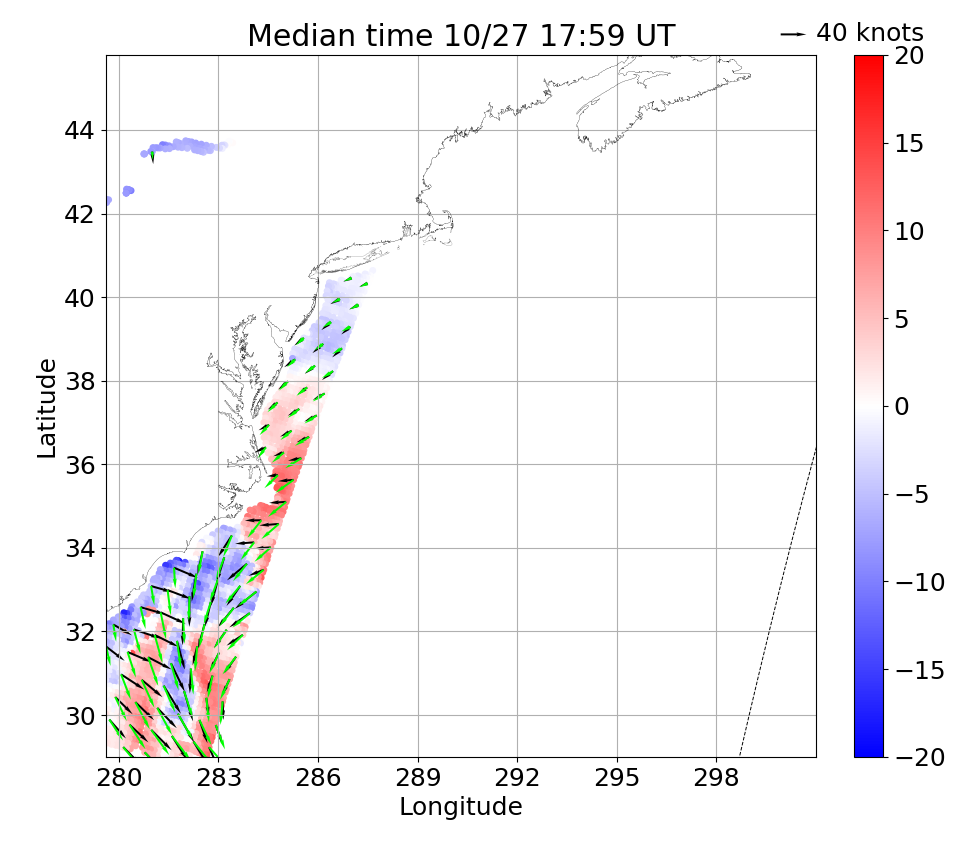
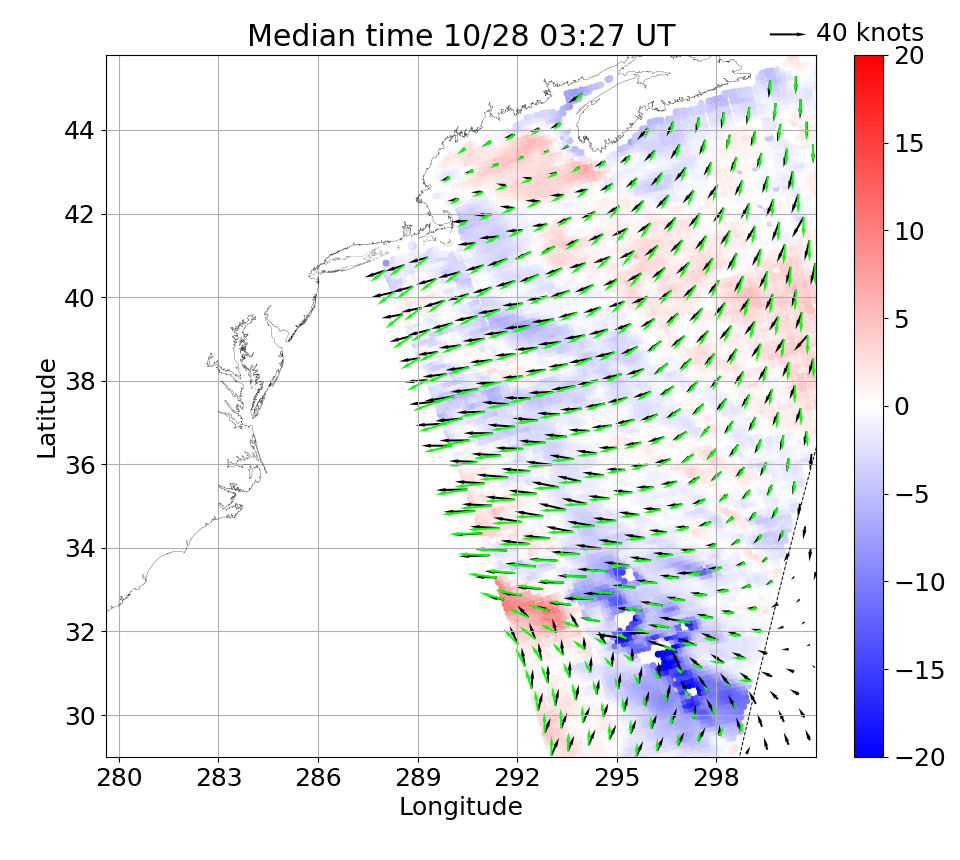
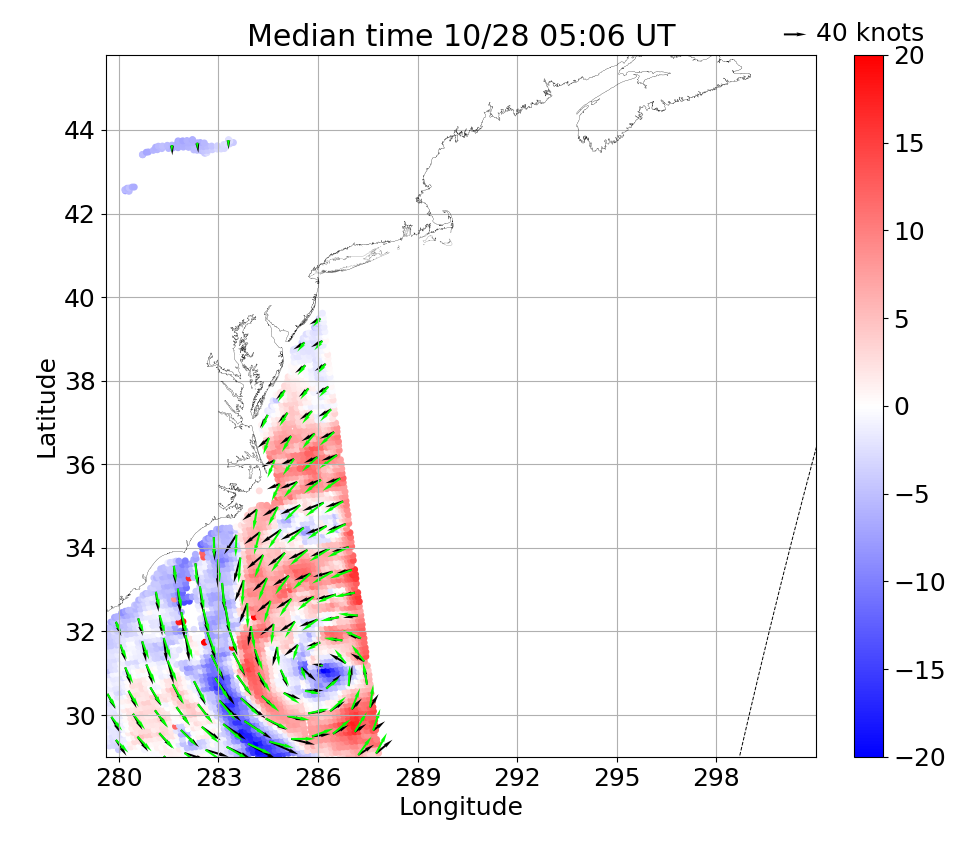
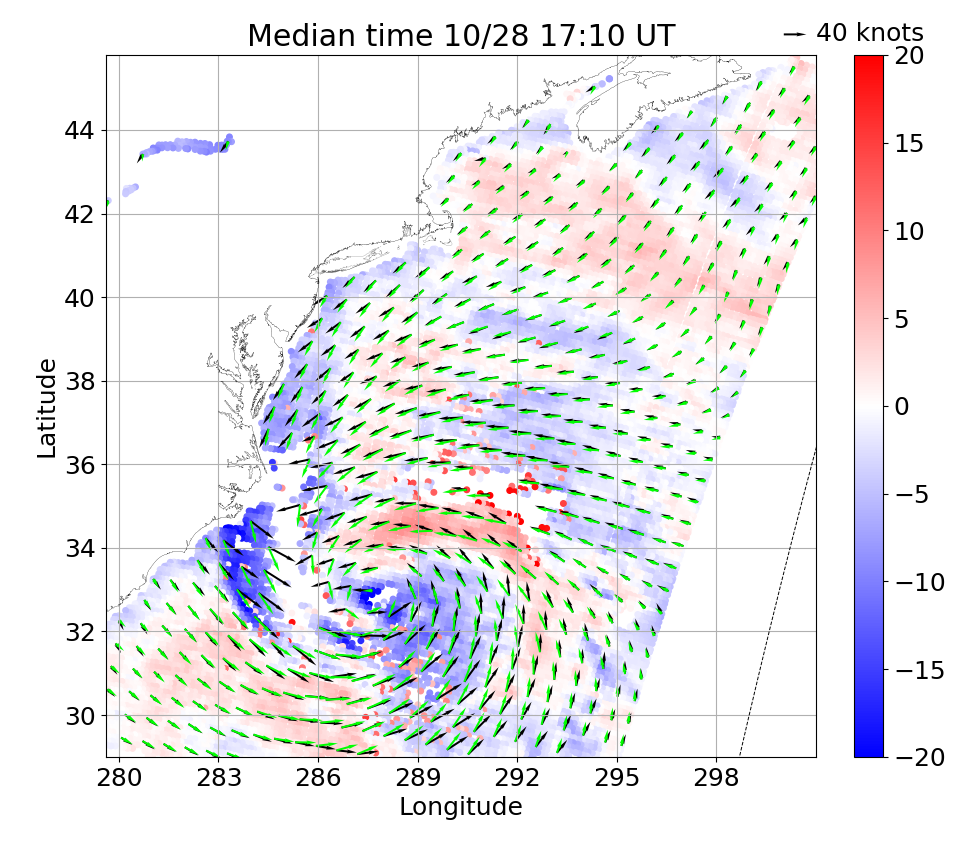
This section contains two exemplary plots with captions. The appendices contain the remaining figures for other times or stations. Figure 4 shows a snapshot of scatterometer and NAM data on October 29 in the region of interest. Appendix A contains a complete list of analogous figures for other times, i.e. all available times for which Oceansat-2 recorded data during the interval from October 25, 2012 at 12:00 UTC, to October 31 at 6:00 UTC.
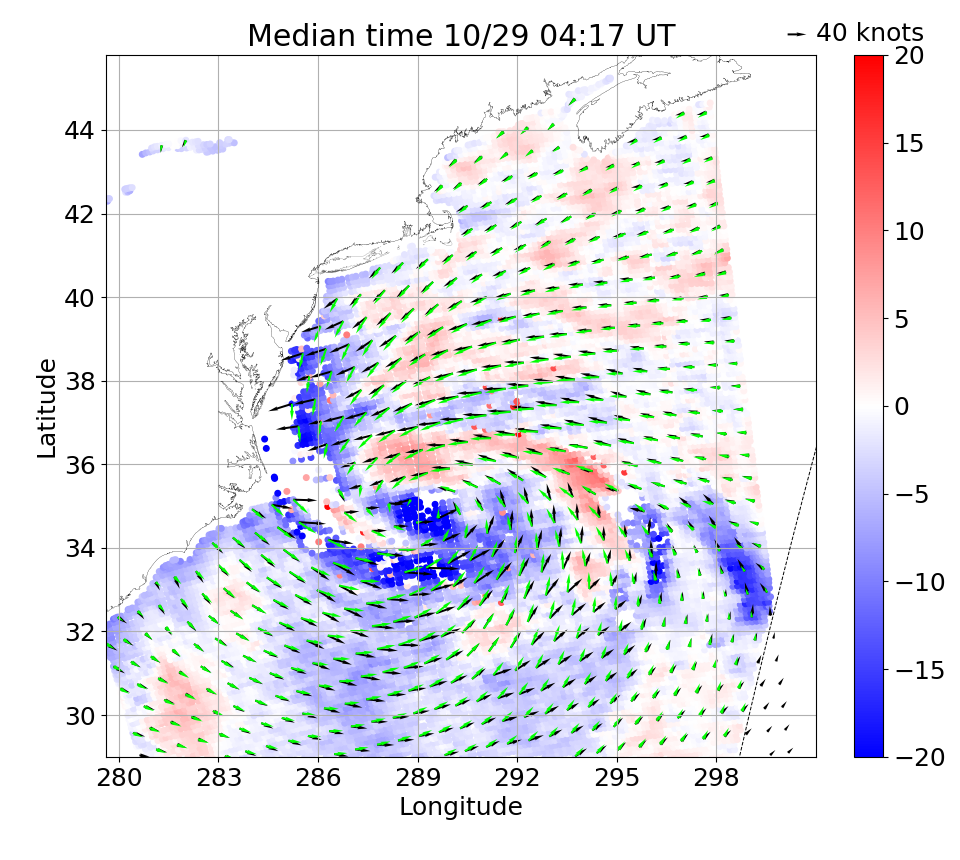
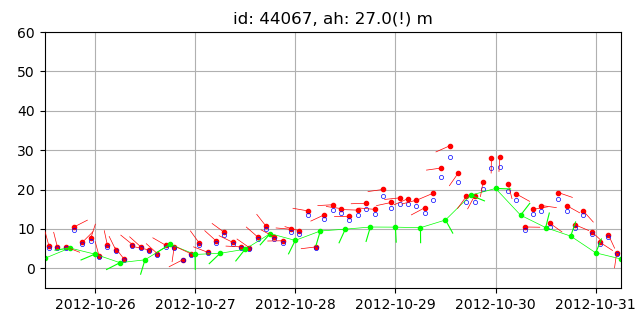
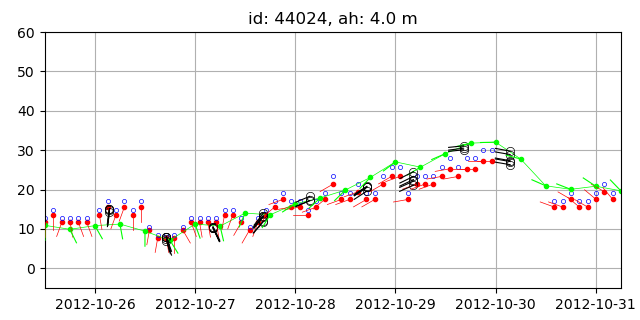
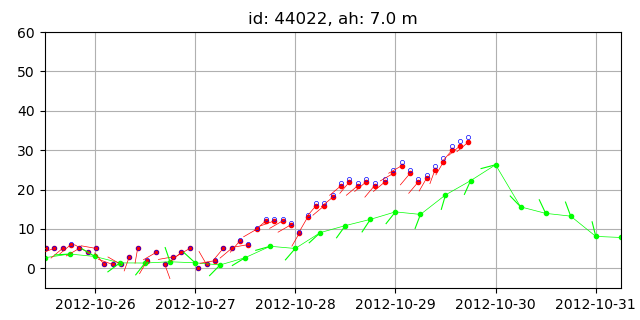
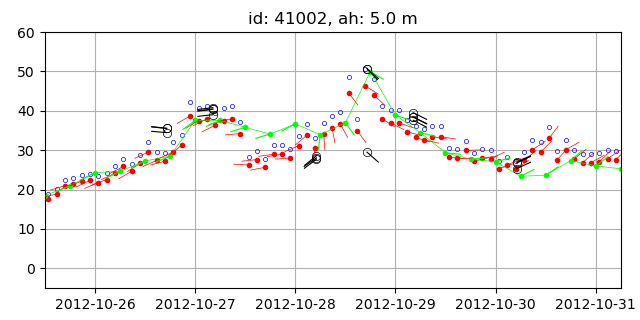
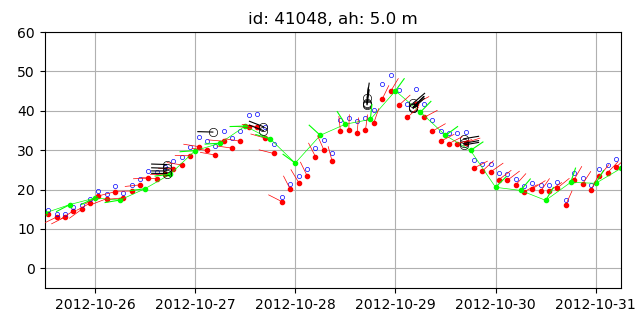
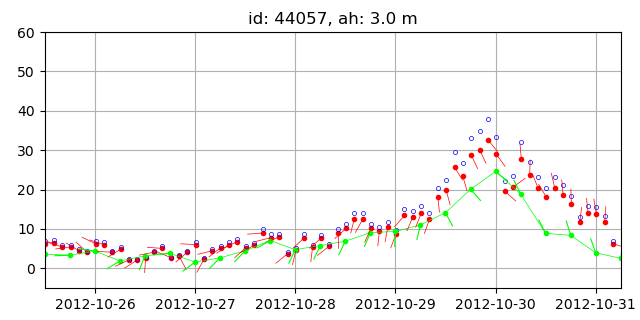
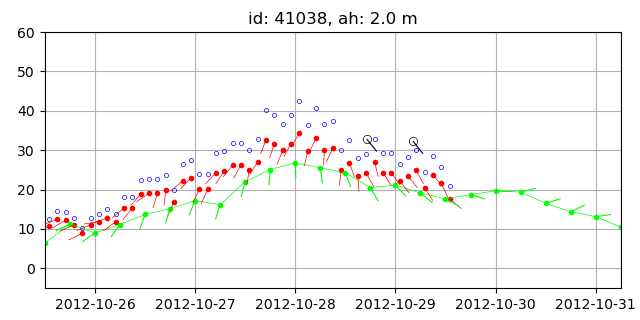
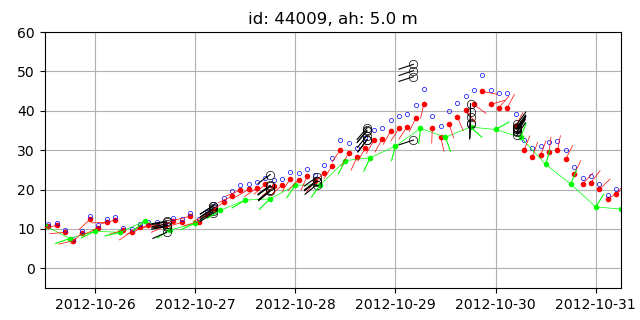
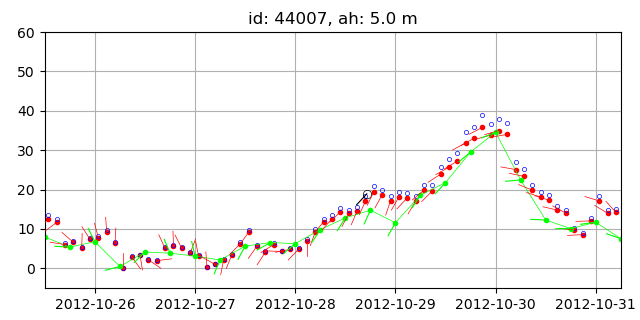
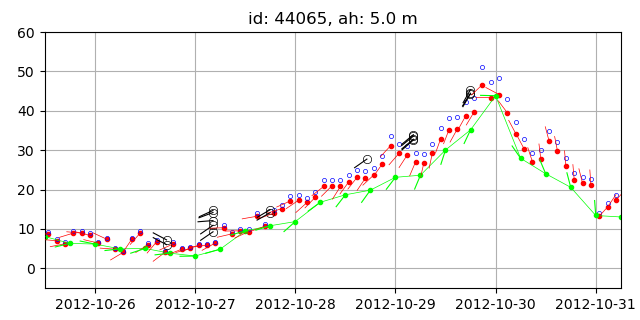
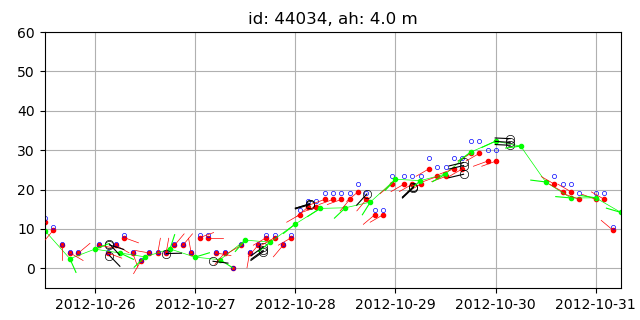
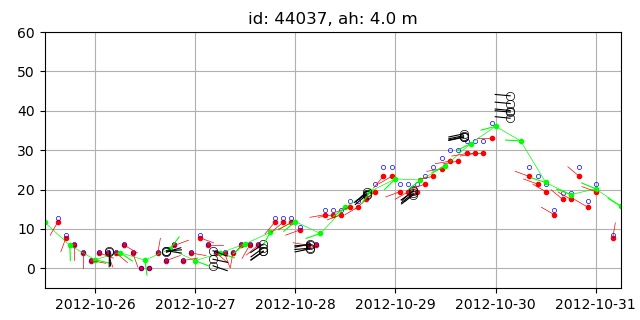
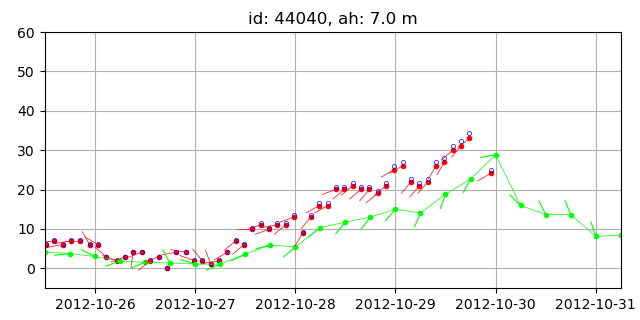
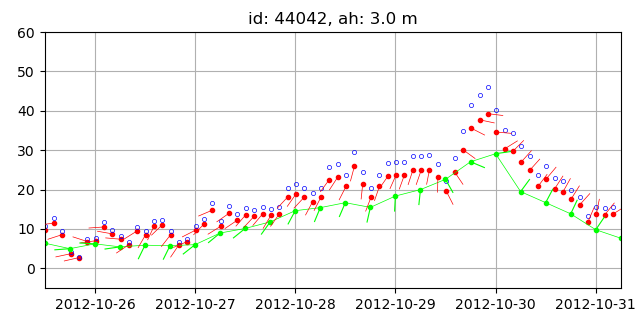
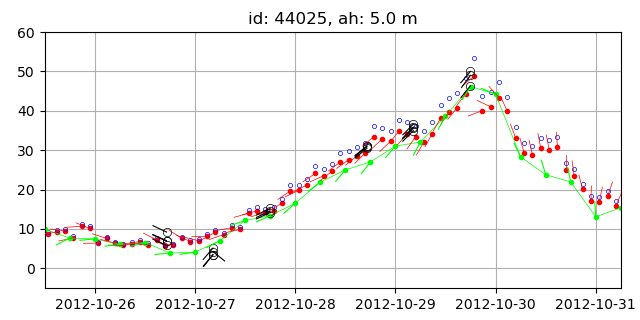
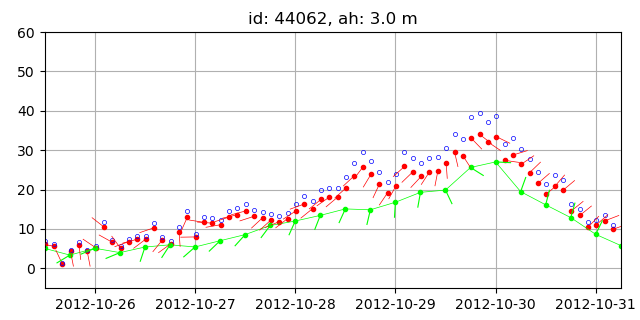
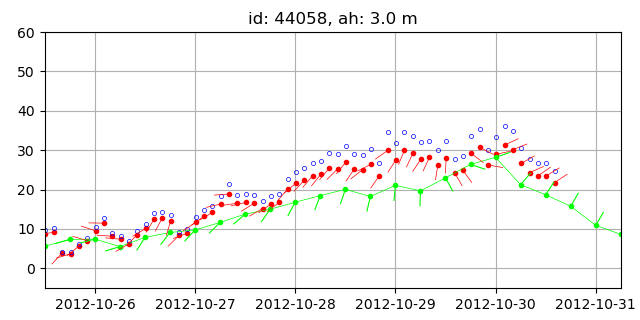
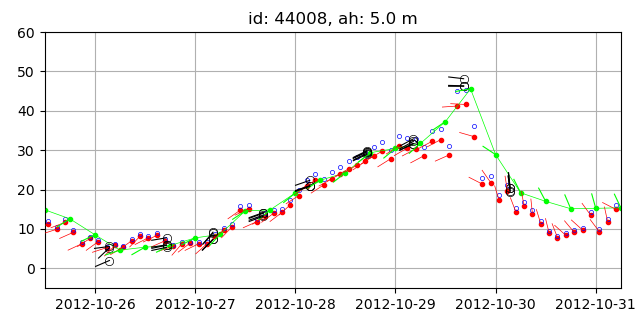
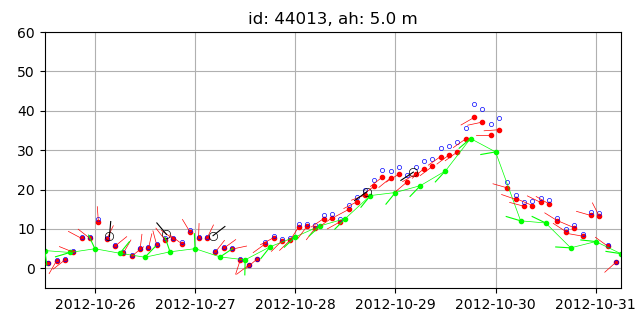
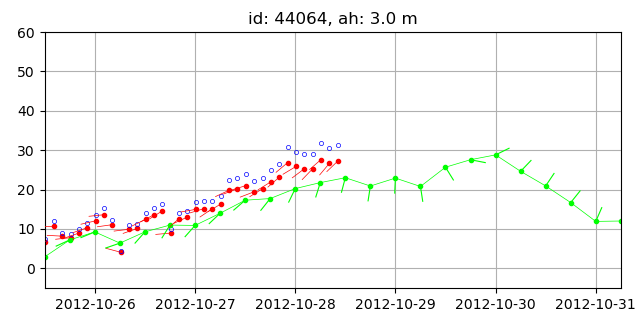
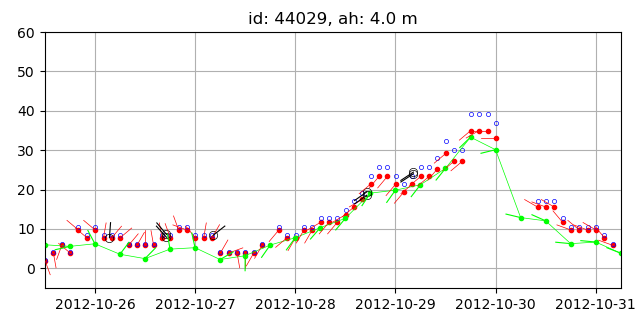
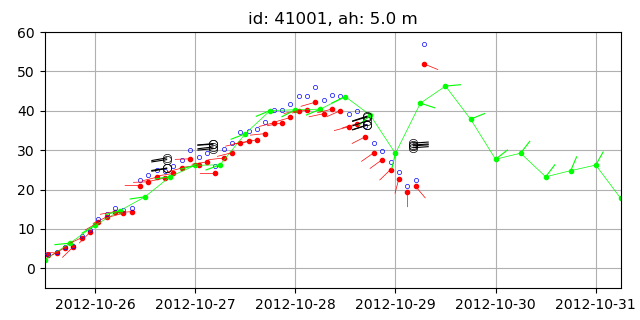
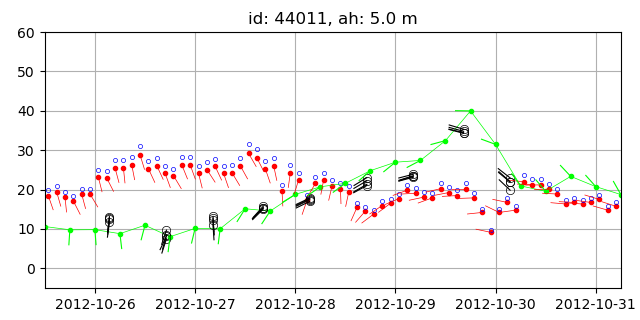
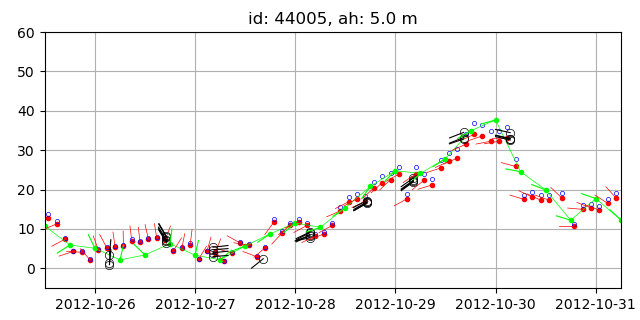
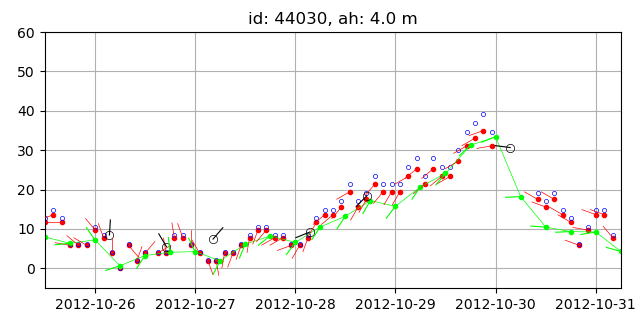
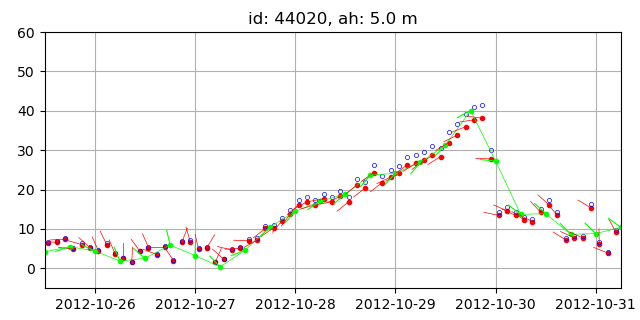
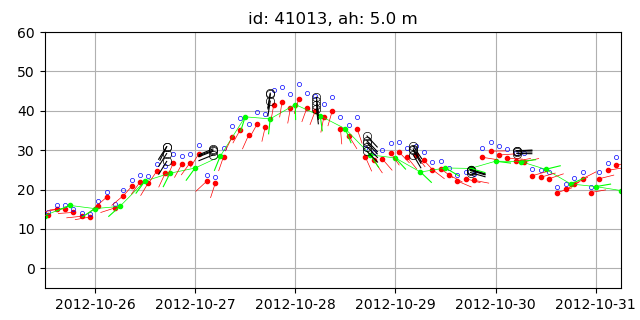
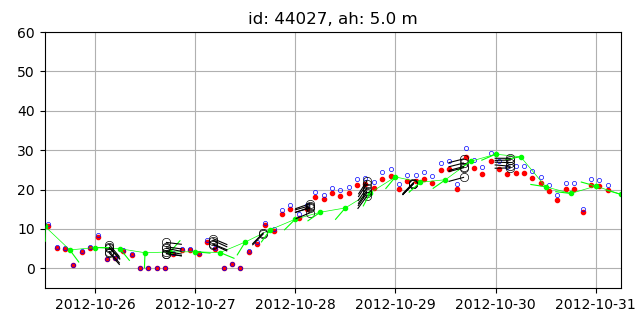
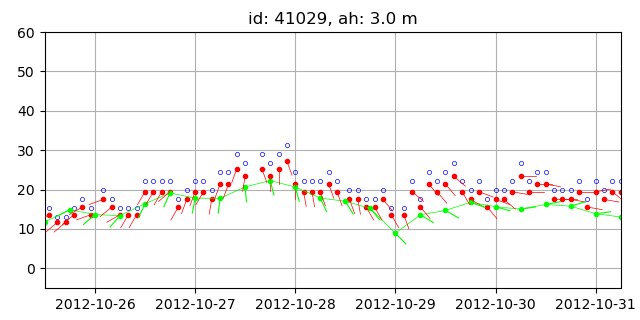
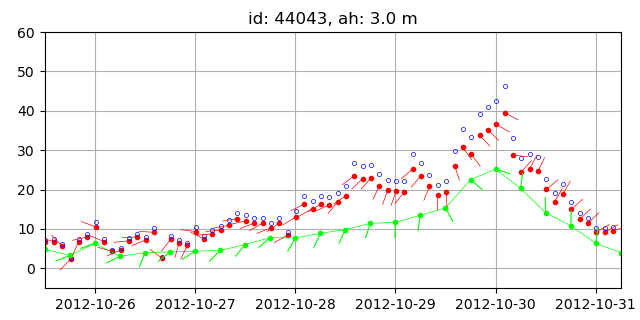
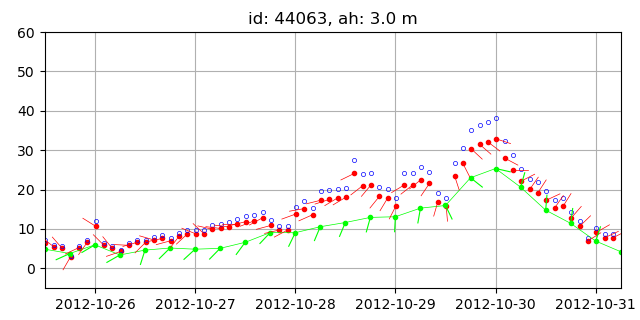
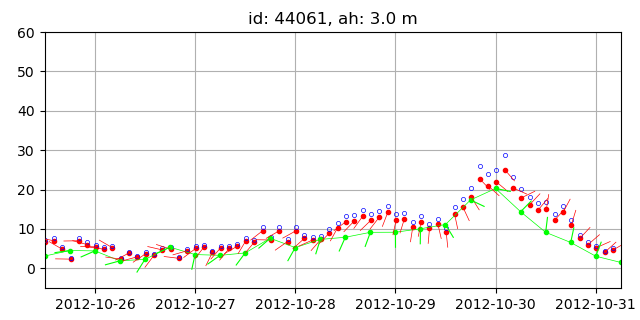
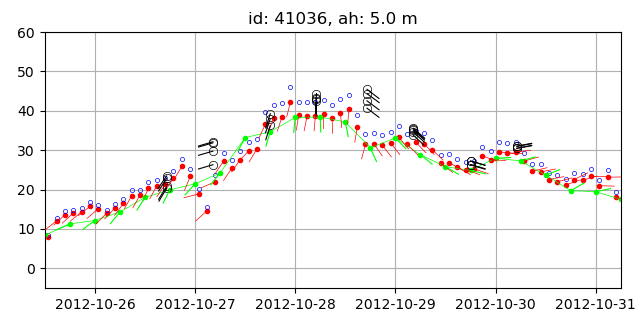
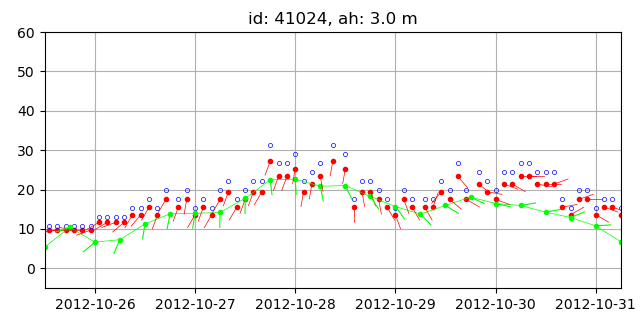
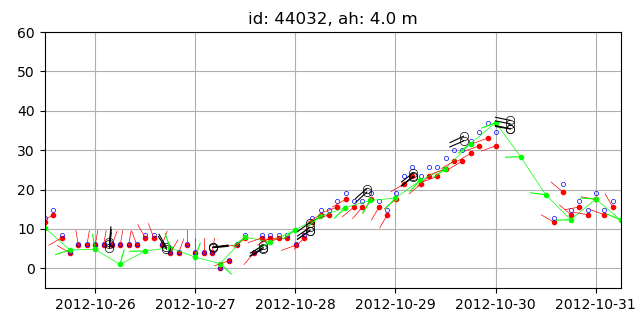
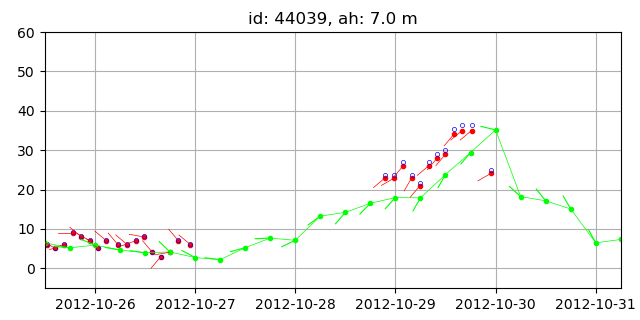
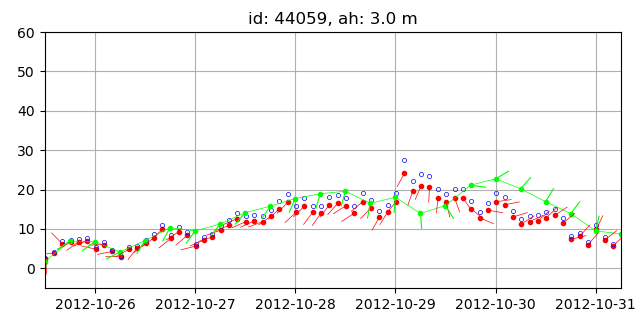
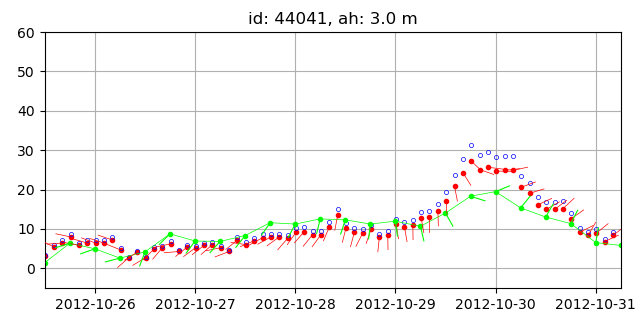
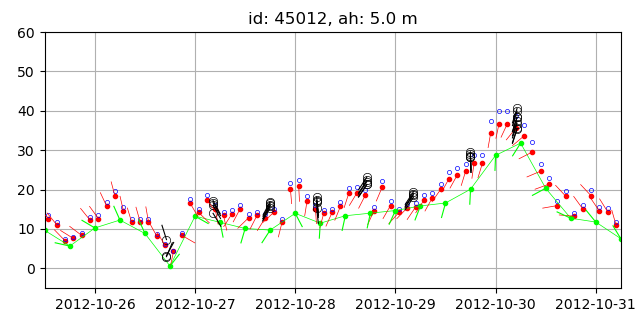
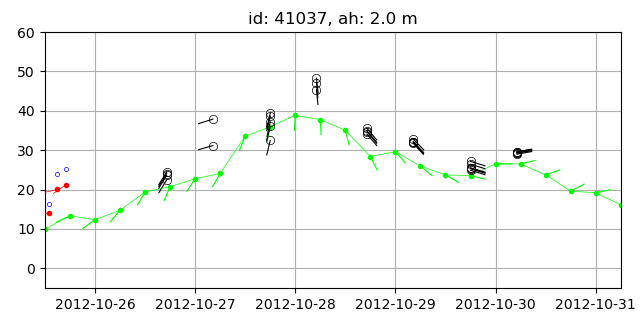
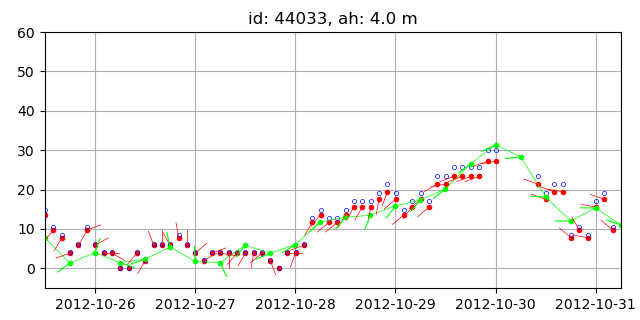
Figure 5 shows time series data recorded by NDBC buoys. Appendix B contains a complete list of analogous figures for other stations, i.e. all stations shown in Figure 3. Note that the figures in Appendix B are bitmap figures and have lower resolution than the examplary Figure 5. This is to make the web version of this document load quicker.
 to the
metadata
  sheet. Blue
circles show wind speed at 10 m assuming the neutrally stable logarithmic vertical wind profile
relation used e.g. by
Bidlot et al. (2002). Black circles (strokes) show
scatterometer neutral wind speed (direction) of wind vector cells close to the station. Cells are shown if they are
located within a square of roughly 25 km width centered at the station. Data extracted from NCEP-NAM is plotted in green.
5 Acknowledgements
Data was provided by NCEP, NDBC, the NASA Jet Propulsion Laboratory QuikSCAT Project, the Indian Space Research Organization and others. G.N. Seroka 


6 Appendix A

7 Appendix B
References
- Beudin, A., Ganju, N.K., Defne, Z., Aretxabaleta, A.L., 2017: Physical response of a back‐barrier estuary to a post‐tropical cyclone.
- Bidlot, J. R., Holmes, D. J., Wittmann, P. A., Lalbeharry, R., Chen, H. S., 2002: Intercomparison of the Performance of Operational Ocean Wave Forecasting Systems with Buoy Data
- Charnock, H., 1955: Wind stress on a water surface.
- Demuth, J., DeMaria, M., Knaff, J.A., 2006: Improvement of advanced microwave sounder unit tropical cyclone intensity and size estimation algorithms.
- Fairall, C.W., Bradley, E.F., Rogers, D.P., Edson, J.B., Young, G.S., 1996: Bulk parameterization of air‐sea fluxes for tropical ocean‐global atmosphere coupled‐ocean atmosphere response experiment.
- Georgas, N., Blumberg, A.F., 2009: Establishing confidence in marine forecast systems: The design and skill assessment of the New York Harbor Observation and Prediction System, version 3 (NYHOPS v3).
- Georgas, N., Orton, P., Blumberg, A., Cohen, L., Zarrilli, D., Yin, L., 2014: The impact of tidal phase on Hurricane Sandy's flooding around New York City and Long Island Sound.
- Hersbach, H., 2011: Sea surface roughness and drag coefficient as functions of neutral wind speed.
- Jaruwatanadilok, S., Stiles, B.W., Fore, A.G., 2014: Cross-calibration between QuikSCAT and Oceansat-2
- Jenkins III, R.L., 2015: Surface wave analysis based on a hydrodynamic modeling system for the Delaware coastal environment.
- KNMI, 2017: Oceansat-2 L2 winds Data Record Product User Manual
- Liu, W.T., Katsaros, K.B., Businger, J.A., 1979: Bulk parameterization of air-sea exchanges of heat and water vapor including the molecular constraints at the interface.
- Massey, C., Byrd, A., Pradhan, N., Melby, J., Smith, J., Walker, R., Wozencraft, J., 2012: ERDC Support forHurricane Sandy.
- Orton, P., Georgas, N., Blumberg, A., Pullen, J., 2012: Detailed modeling of recent severe storm tides in estuaries of the New York City region.
- Paim Ferraz Rodrigues, A., 2016: Hydrodynamic modeling of Delaware Bay with applications to storm surges and coastal flooding: current conditions and future scenarios.
- SeaPAC (SeaWinds Processing and Analysis Center), 2013: Oceansat-2 Scatterometer Level 2B Ocean Wind Vectors in 12.5km Slice Composites Version 2.